The Millennial Mortgage Lending Gap in Illinois
An analysis of 1.3 million Illinois mortgage applications, including over 828,000 millennial mortgage applications, between 2018 and 2024.
Executive Summary
Millennials are no longer the future—they are a significant share of the current workforce, shape mortgage markets, and are powerful influencers of the economy. Even though millennials are a significant share of the population, they have not accumulated wealth at the same rate as older generations. The median age of first-time homebuyers has reached a historic high, and the racial wealth gap persists. Millennials’ path to financial independence has been turbulent, entering the workforce during the Great Recession and the 2008 foreclosure crisis. This not only affected millennials’ income and wealth accumulation, but also the assets of their parents, especially Black and Latine families disproportionately targeted by subprime lending. Compared to older generations, millennials also carry a greater share of non-mortgage debt, related to student loans and other consumer debts, creating another barrier to mortgage readiness. In Illinois, these broader economic pressures intersect with longstanding racial disparities in income, wealth, access to equity, and the cost of credit.
To understand the most recent group of applicants 25 to 44 years old, as a proxy for millennials, buying principal residences in Illinois, Woodstock Institute examined over 828,000 mortgage applications, provided by the Home Mortgage Disclosure Act (HMDA) from 2018 to 2024. This analysis covers Illinois, the six collar counties, suburban Cook County, and Chicago. These are a few of the key findings:
- Underrepresentation in the applicant pool. Black and Latine millennials are underrepresented among applicants compared to their population share across all four geographies, while White and Asian applicants are proportionally represented or overrepresented—suggesting disparities in mortgage access before applications are even filed.
- Weaker financial starting positions. Black and Latine millennial borrowers entered homeownership with lower incomes, higher debt-to-income ratios, and less initial equity. Statewide, 82.9 percent of Black borrowers and 68.8 percent of Latine borrowers have a combined loan-to-value (CLTV) ratio over 95 percent, compared to only 43.6 percent of White borrowers and 27.4 percent of Asian borrowers, indicating less initial equity.
- Persistent origination and denial gaps. Chicago showed pronounced disparities between Black and White millennial mortgage applicants, with Black millennial applicants denied four times the rate of White millennial applicants.
- Debt burdens are significantly higher for Black and Latine millennial applicants. Statewide, only 25.6 percent of White millennial applicants had debt-to-income (DTI) ratios over 43 percent, compared with 47.6 percent and 43.9 percent of Black and Latine applicants, respectively.
- Affordability pressures were greatest for Latine millennial borrowers across all four geographies. Latine millennial borrowers consistently had the highest median loan-to-income ratios, showing that smaller loan amounts did not necessarily translate to greater affordability.
- Black millennial borrowers were more likely to obtain mortgage credit through higher-cost products and institutions. In 2024, Black millennial borrowers faced substantially higher median loan costs than White and Asian millennial borrowers, even though Black borrowers generally received smaller loan amounts and purchased lower-value properties.
The findings in this report show that millennial homebuyers were impacted at almost every stage in the mortgage buying process, from market entry to underwriting to the price of credit, with each factor compounding with another. These conditions can leave new homeowners with fewer resources to absorb repairs, income shocks, economic downturns, and other unexpected expenses. This not only impacts homeowners, but also long-term housing quality and neighborhood stability. Without meaningful intervention, these disparities documented among Illinois millennials risk being reproduced for Generation Z and future generations. Addressing these compounding barriers will require coordinated action across the mortgage market, housing finance system, and broader wealth-building landscape.
Recommendations
- Expand access to affordable, conventional credit and reduce reliance on higher-cost FHA and non-bank lending among Black and Latine borrowers, including by ensuring eligible borrowers are informed of conforming-loan options.
- Strengthen, not weaken, CRA enforcement at the state and federal level to hold lenders accountable for serving low- and moderate-income communities.
- Fund housing counseling agencies and down payment/closing-cost assistance programs, which prepare borrowers for sustainable homeownership and reduce upfront barriers to entry.
- Support post-purchase financial stability through affordable home-repair financing, employer-sponsored emergency savings, and student debt relief that frees up capacity to save for a home.
- Invest in non-traditional wealth-building models — community land trusts and limited-equity cooperatives — that offer shared-equity pathways for households facing barriers to traditional homeownership.
Introduction
Millennials, born between 1981 and 1996, now represent the largest generation in the United States housing market, yet their path to homeownership has become increasingly constrained. According to the National Association of Realtors (2025), the median age of first-time homebuyers has reached the historic high of 40 years old, amid mounting affordability pressures, debt burdens, rising interest rates, and limited entry-level inventory1. Homeownership has traditionally been a powerful tool for wealth generation, and barriers within the traditional lending system continue to exacerbate wealth disparities.
The racial wealth gap has not narrowed in the past 30 years2 and millennials reflect this reality through their tumultuous journey into wealth building. The Great Recession (2007-2009), driven primarily by sub-prime mortgage lending, destroyed vast amounts of generational wealth and created widespread job losses at the moment when many millennials were joining the workforce. During that time, the unemployment rate rose from 5 percent to a peak of 10 percent nationally3. The subsequent foreclosure crisis impacted Black and Latine households significantly, further widening the racial wealth gap during a period when many millennials were early in their careers and wealth-building journey. A decade later, the COVID-19 pandemic and its related recession disrupted millennials’ prime homebuying years, affecting employment, the cost of living, mortgage rates, and housing demand.
Millennials, who obtained degrees at a higher rate than older generations4, also entered adulthood during a period of rising education costs and increasing reliance on student debt5. For many borrowers without access to family wealth, this non-mortgage debt added another financial pressure while they were building their careers, saving for a home, and building wealth. For Black millennials, higher borrowing and lower family wealth increased the financial burden of obtaining an education, while Latine millennials experience different debt patterns shaped by lower incomes, lower household wealth, and other consumer debt. These debt burdens can affect household savings, monthly debt obligations, and the amount of mortgage credit a borrower can reasonably support.
Economic downturns and financial pressures are shaping the financial priorities of younger generations, contributing to delayed household formation and homeownership. Nationally, the rate of homeownership for millennials is much lower than the national rate, and this homeownership gap is most severe in high-cost metropolitan areas. Within this generational homeownership gap, the racial gap persists, mimicking historic lending disparities6. Young adults are also delaying marriage and increasingly living with their parents or roommates longer. In 2024, approximately 38 percent of 25- to 34-year-olds lived with either parents or roommates, up from 26 percent in 2005. As household formation declines, so does the rate of homeownership7. At the same time, Generation X and baby boomers are more likely to age in place8 and the production of affordable housing is lagging9, making affordable housing inventory limited, further restricting millennials’ opportunity to accumulate financial assets and wealth through homeownership.
To assess the state of millennial homeownership locally, this report analyzes approximately 828,000 millennial mortgage applications to examine borrowers’ financial positioning, lending outcomes, affordability pressures, and cost of credit. Using Home Mortgage Disclosure Act (HMDA) lending data from 2018 to 2024, this report examines millennial mortgage applicants (those between 25 to 4410), in Chicago, IL, suburban Cook County, six collar counties (DuPage, Kane, Kendall, Lake, McHenry, and Will counties), and Illinois. This analysis includes first-lien, home-purchase loans on one-to-four-unit principal residences. These findings raise important questions about whether existing housing finance systems are adequately supporting the next generation of homebuyers and provide recommendations for state and local policymakers.
Millennial context
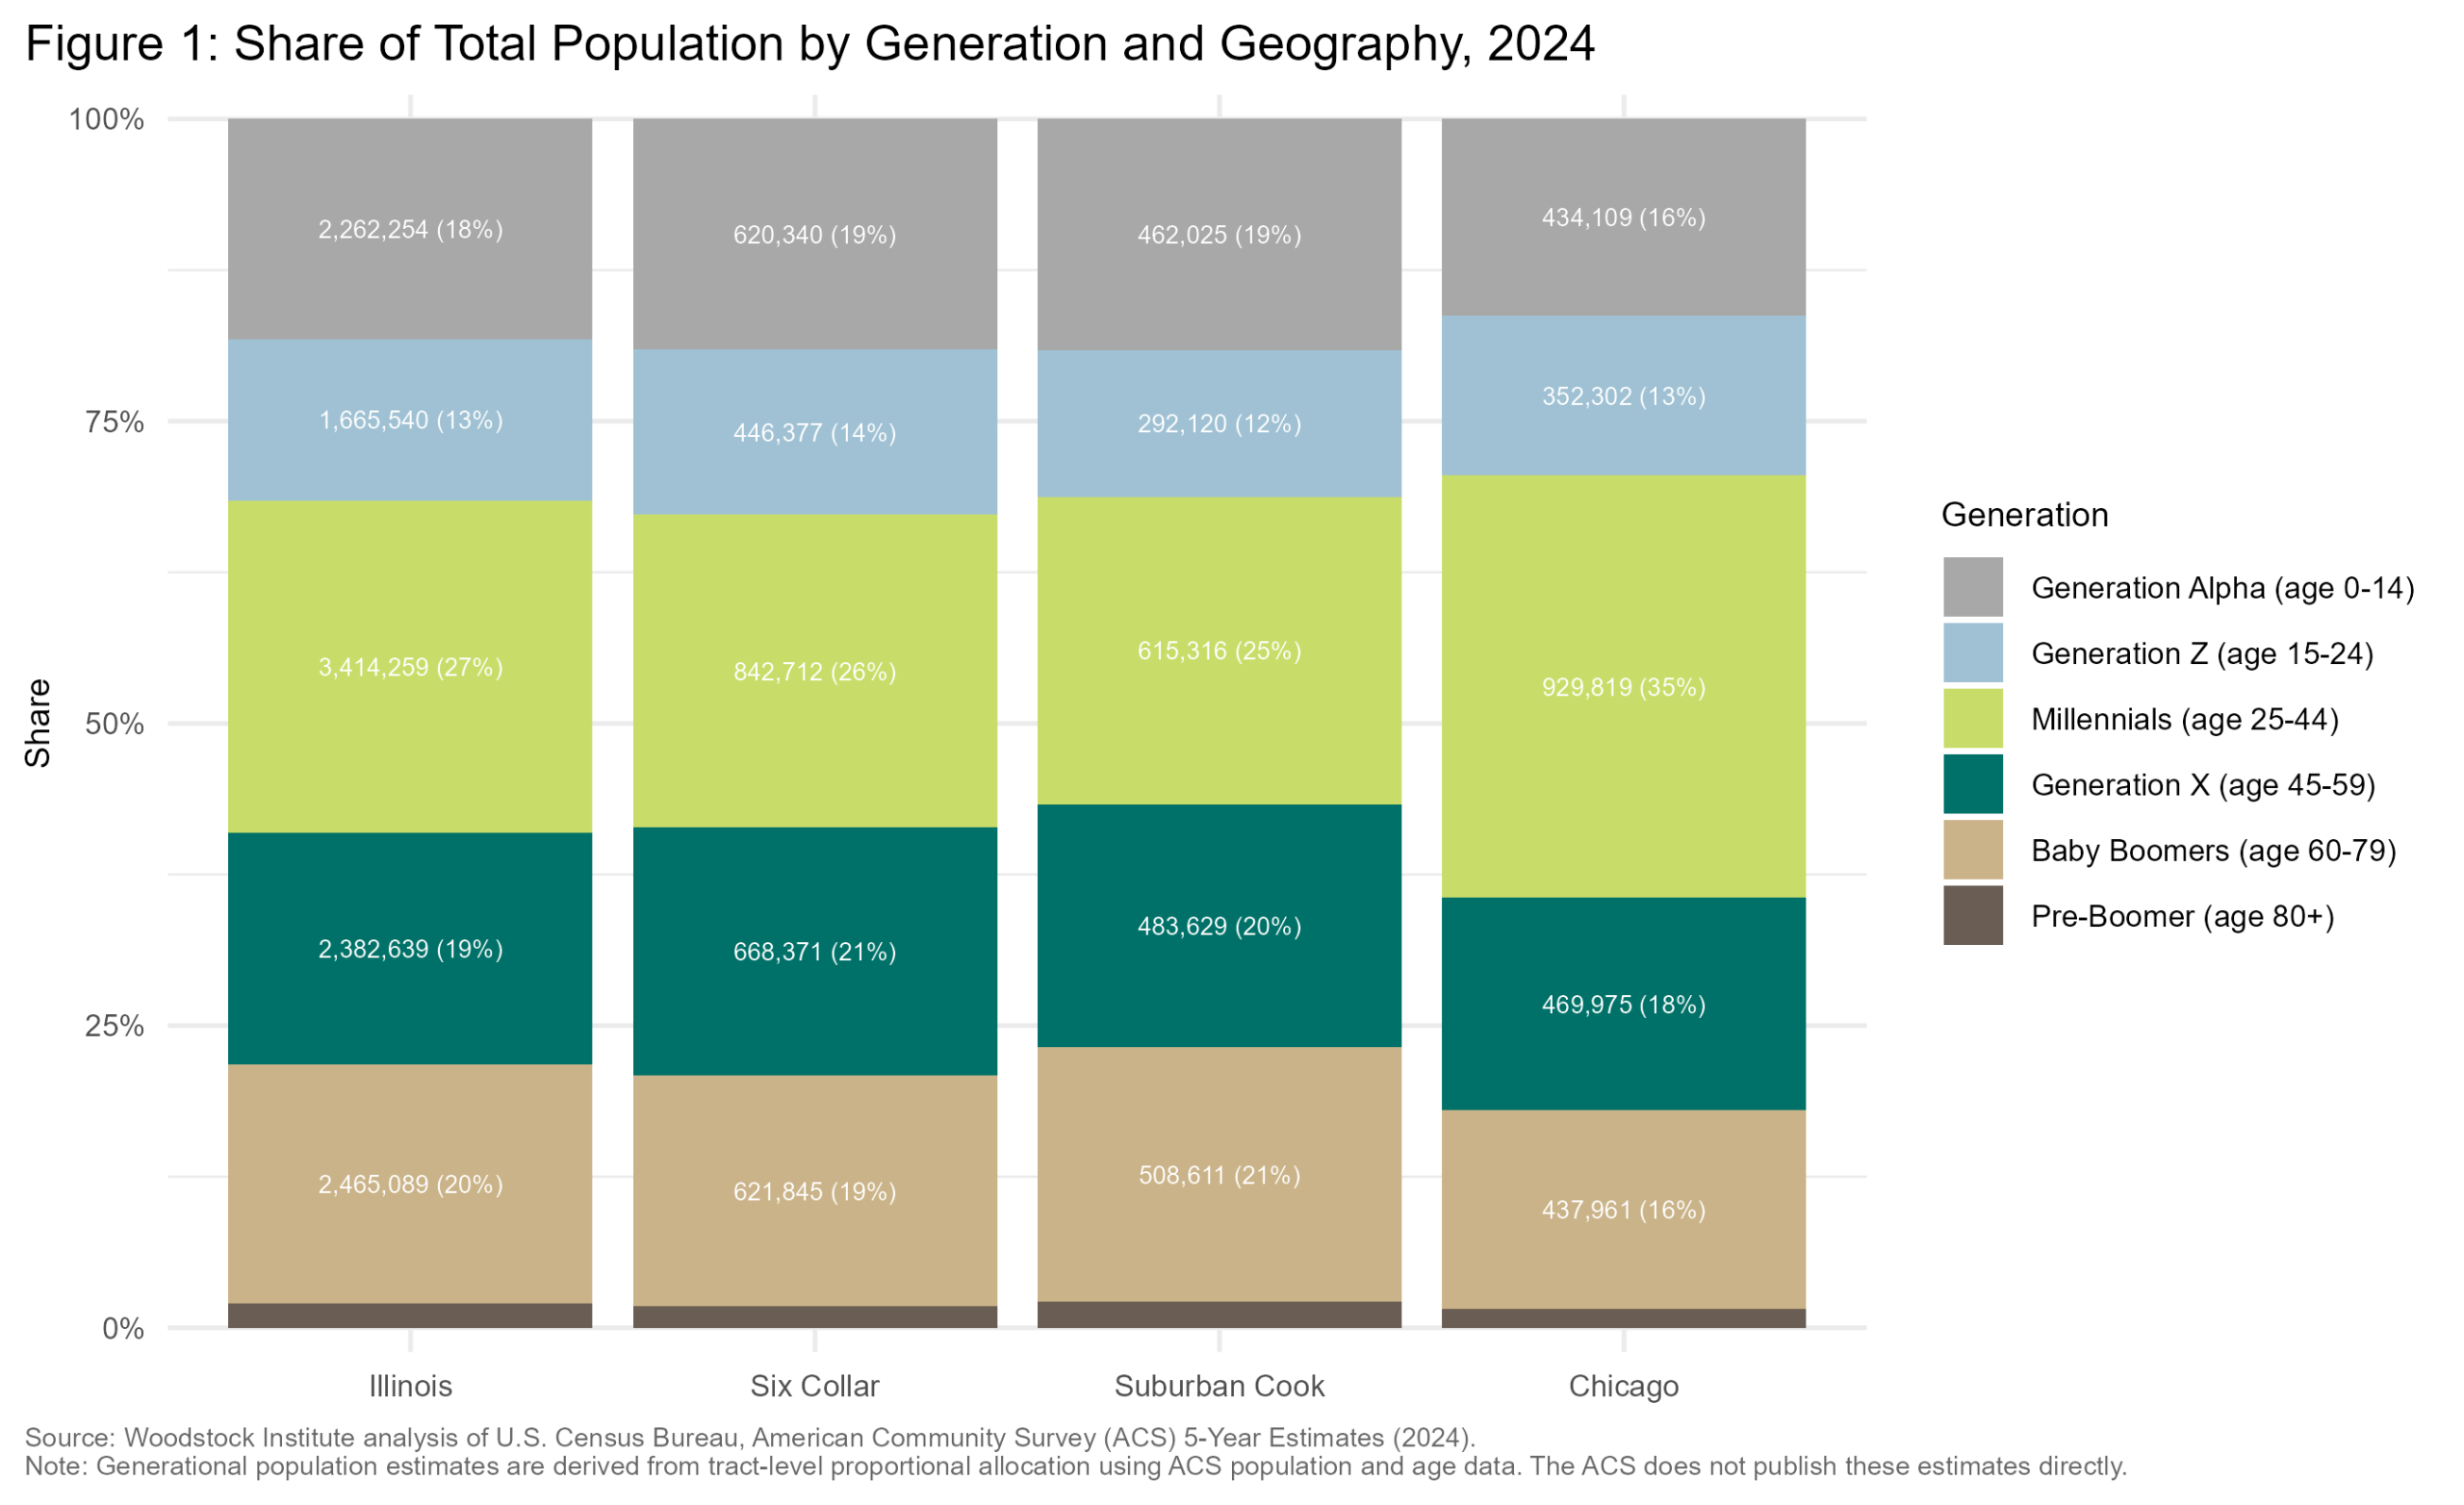
According to the U.S. Census American Community Survey, millennials are the largest generational share of the population across all four geographies11, with Chicago holding the highest concentration of millennials compared to the other regions. The six collar counties and suburban Cook County skew slightly older with larger shares of residents over 44 years old. This section details the millennial population across geographies and by race. It also shows the mortgage applications received during the seven-year period to provide a foundation for the lending analysis that follows. (Figure 1)
chart_a2_total_population_by_generation_pct.png / .jpg / .jpegCheck the file exists in the graphs folder and that this HTML is opened from a browser with local file access enabled.
Millennial population by race
The racial composition of Illinois’ millennials varies substantially across geographies. Chicago and suburban Cook County are the most diverse, with Black and Latine millennials together comprising over 40 percent of their millennial populations, similar to the wider population. The six collar counties and Illinois as a whole, by contrast, are majority White at 58.2 percent and 56.2 percent, respectively, with a smaller but notable Latine millennial presence at 23 percent and 19.8 percent, respectively. These geographic differences in racial composition provide important context for understanding where millennial homeownership opportunities and challenges are most concentrated. (Figure 2)
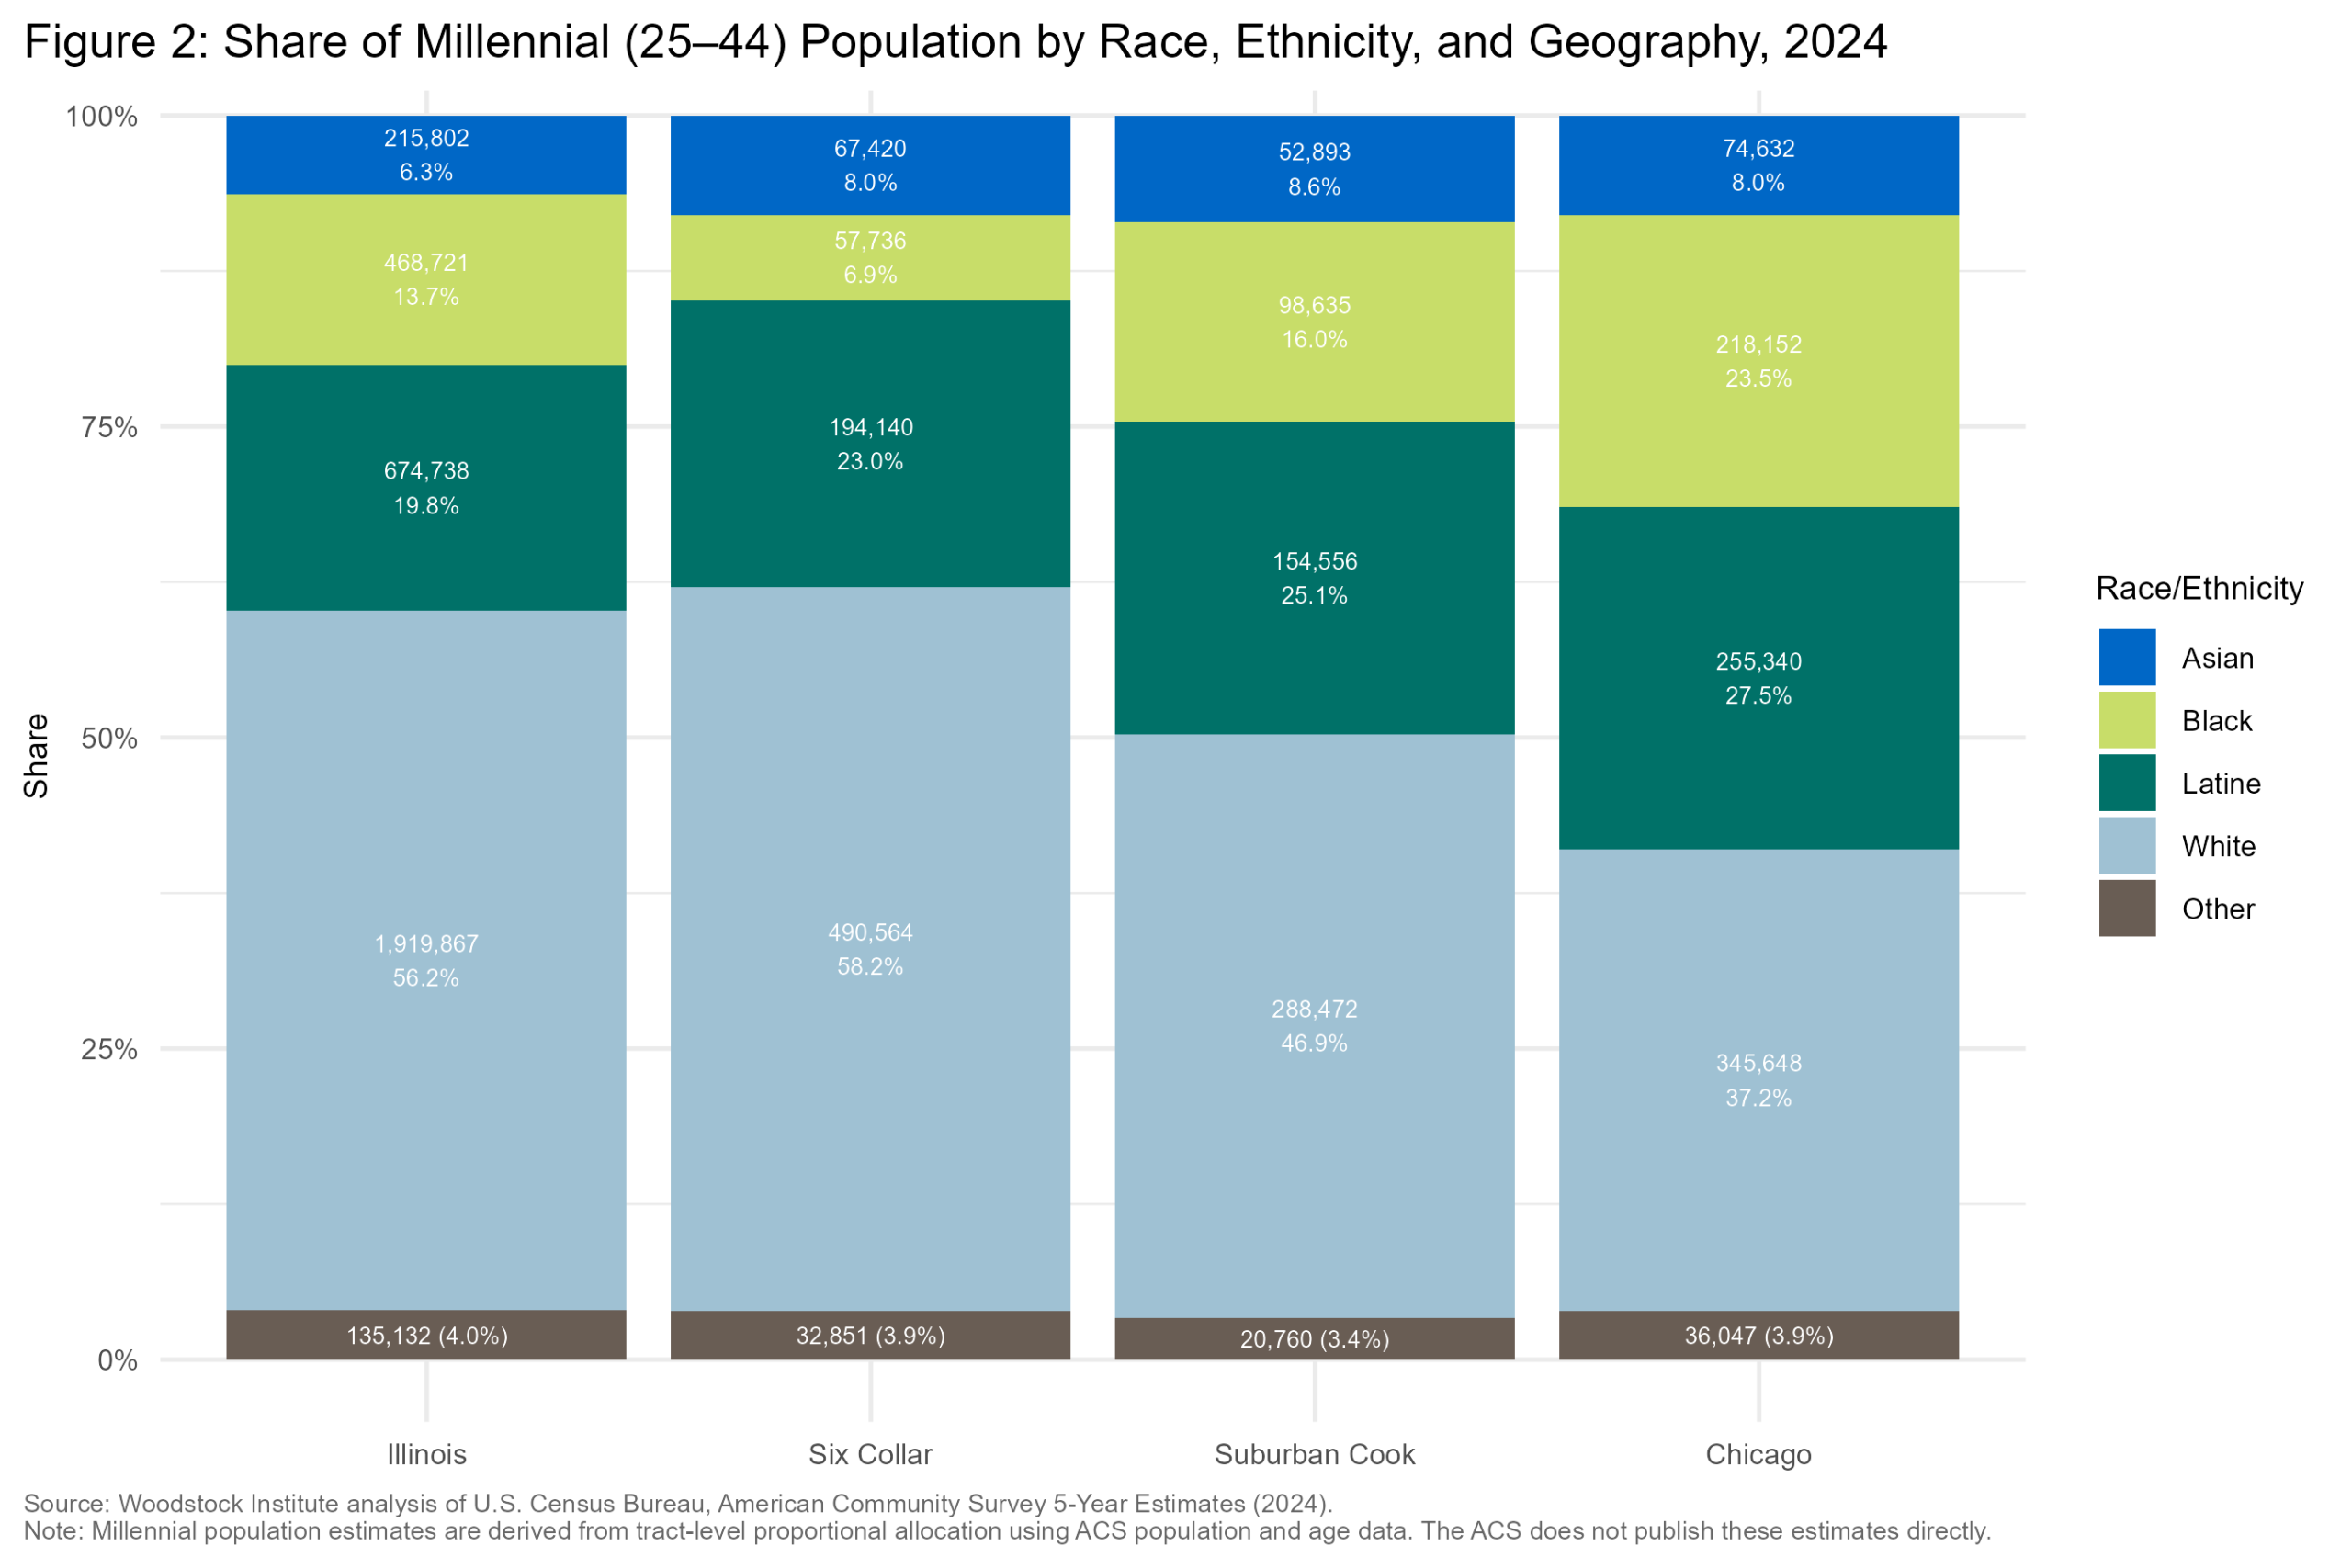
chart2_total_millennial_population_by_race.png / .jpg / .jpegCheck the file exists in the graphs folder and that this HTML is opened from a browser with local file access enabled.
These demographic patterns exist against a backdrop of persistent racial homeownership disparities. In Illinois, 75.1 percent of all White households own their homes compared to 41.2 percent of Black households and 58.3 percent of Latine households. In Chicago, 52.4 percent of White households own their homes compared to 35.2 percent of Black households and 48.4 percent of Latine households12, a 17.2 and 4 percentage point gap, respectively. Black and Latine millennials entering the mortgage market are already starting in a market where the racial wealth gap is deeply entrenched. Without intervention, the racial wealth gap will persist, and wealth building opportunities through homeownership will remain out of reach, especially for Black and Latine millennials. (Figure 2)
Millennial applications by race
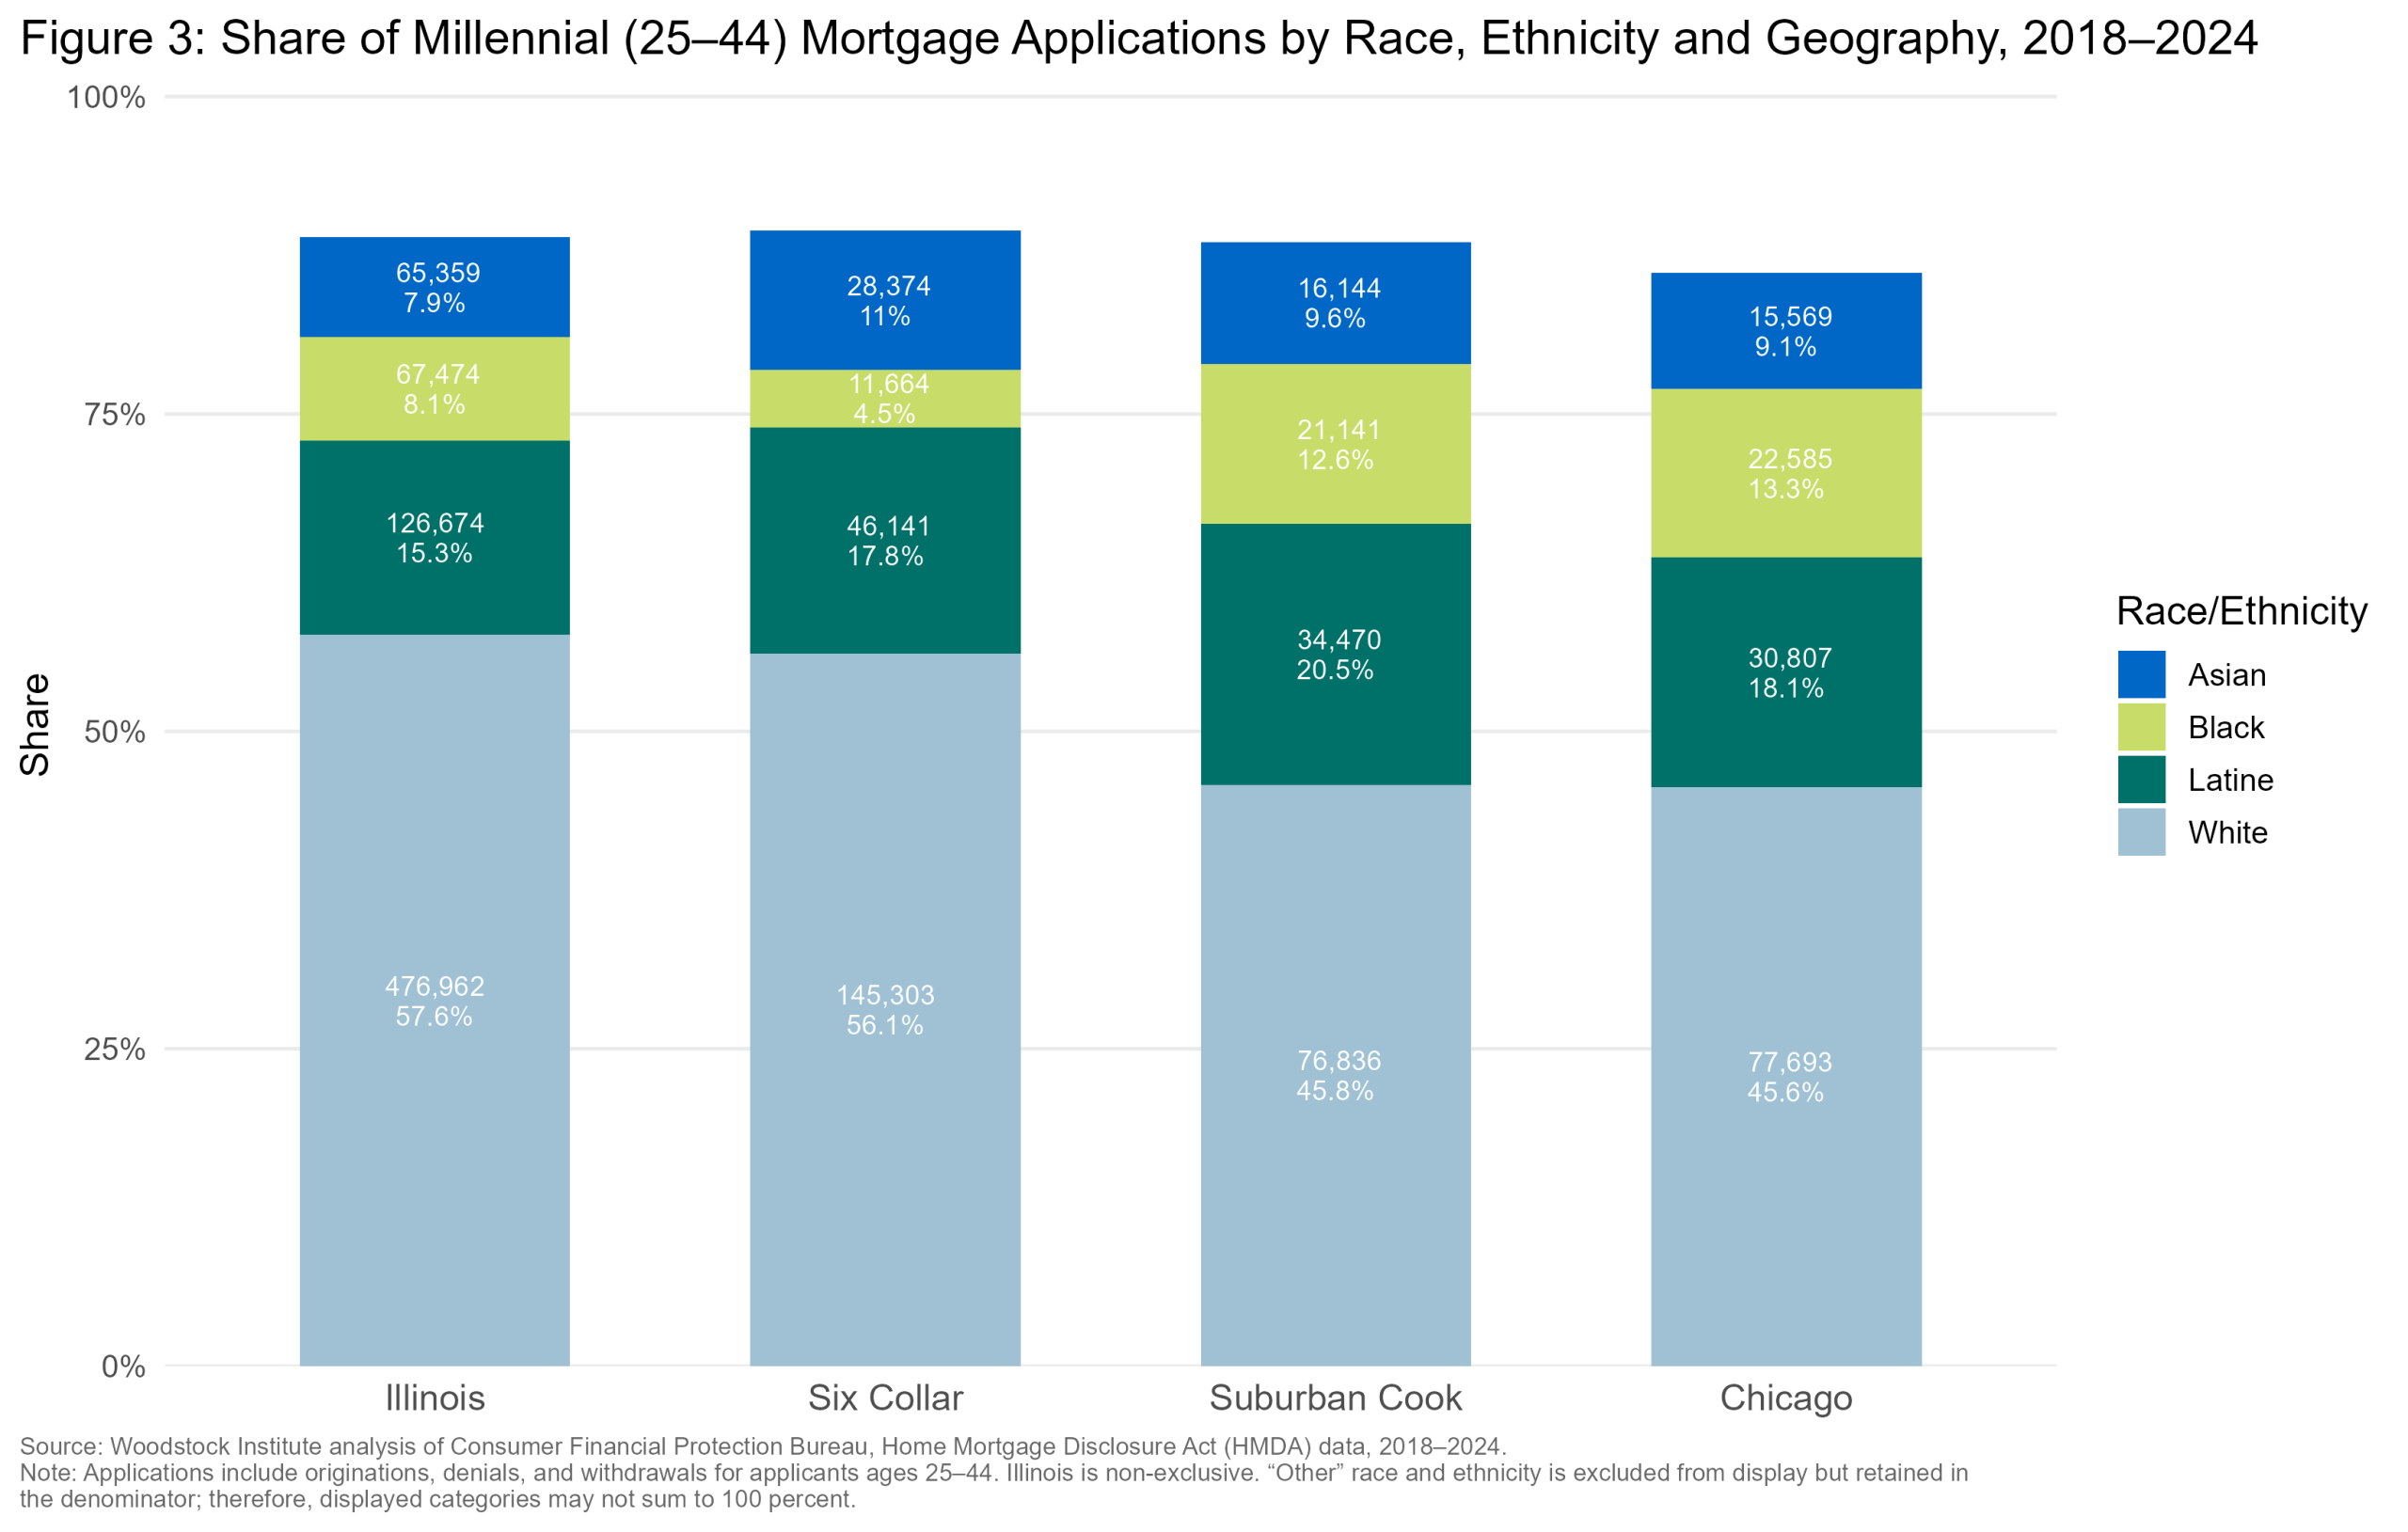
Of the approximately 828,144 millennial (those between ages 25 and 44) mortgage applications analyzed in Illinois, 7.9 percent were from Asian applicants, 8.1 percent were from Black applicants, 15.3 percent were from Latine applicants, and 57.6 percent were from White applicants. In Illinois, White millennial applicants represented a comparable share of the pool of applicants compared to their share of the population but were overrepresented in Chicago by approximately 8.4 percentage points. Asian applicants were slightly overrepresented in every geography. Black and Latine millennial applicants were underrepresented in the mortgage market across all four geographies. This underrepresentation suggests disparities in mortgage access before applications are even received. (Figure 3)
millennial_mortgage_applications_by_race_ethnicity.png / .jpg / .jpegCheck the file exists in the graphs folder and that this HTML is opened from a browser with local file access enabled.
National and regional market conditions
High interest rates and housing prices, compounded by elevated borrowing costs, make homeownership increasingly difficult for homebuyers of all ages and backgrounds. These conditions raise the threshold for entering the mortgage market, making the underrepresentation described above more consequential for households with lower incomes and less accumulated wealth, exacerbating racial disparities. Similar to the nation13, Cook County home prices have increased substantially since 2000, according to the Institute of Housing Studies at DePaul University, with some Chicago neighborhoods seeing an increase of over 200 percent14. This increase in home prices can be partially attributed to the limited supply of housing available for sale. In Chicago alone, “available inventory [of units for sale] has fallen more than half, from 38,250 in 2019 to just 18,300” in 202615, creating limited housing supply for those entering the market. In addition to rapidly increasing home prices, mortgage interest rates have nearly doubled since 2016, and are only currently stabilizing, according to Freddie Mac’s Primary Mortgage Market Survey16. Higher financing costs and the upfront costs associated with obtaining a mortgage reduce the purchasing power of those entering the market. To reasonably participate in the mortgage market, buyers typically need a 10 to 20 percent down payment to compete against other applicants. According to the National Association of Realtors, for some families, it could take a median of four years to save for a 16 percent down payment for a property located in the Chicago or East St. Louis metropolitan statistical areas17. This calculation assumes that applicants could save 15 percent of their median income annually for a down payment18. Millennials are entering their prime homebuying years during a period marked by limited supply, rapidly rising home prices, and inflated mortgage rates and living expenses.
Financial positioning of millennials buying homes
While these market conditions affected all prospective homebuyers, millennials entered the market with these pressures along with varying levels of financial capacity. Examining the financial characteristics of millennial10 applicants from 2018 to 2024, using HMDA data, provides additional insights into how borrowers navigated the affordability challenges. Income, property value, debt-to-income (DTI) ratios, and combined loan-to-value (CLTV) ratios capture different dimensions of borrowers’ capacity and, collectively, can show the financial flexibility of borrowers.
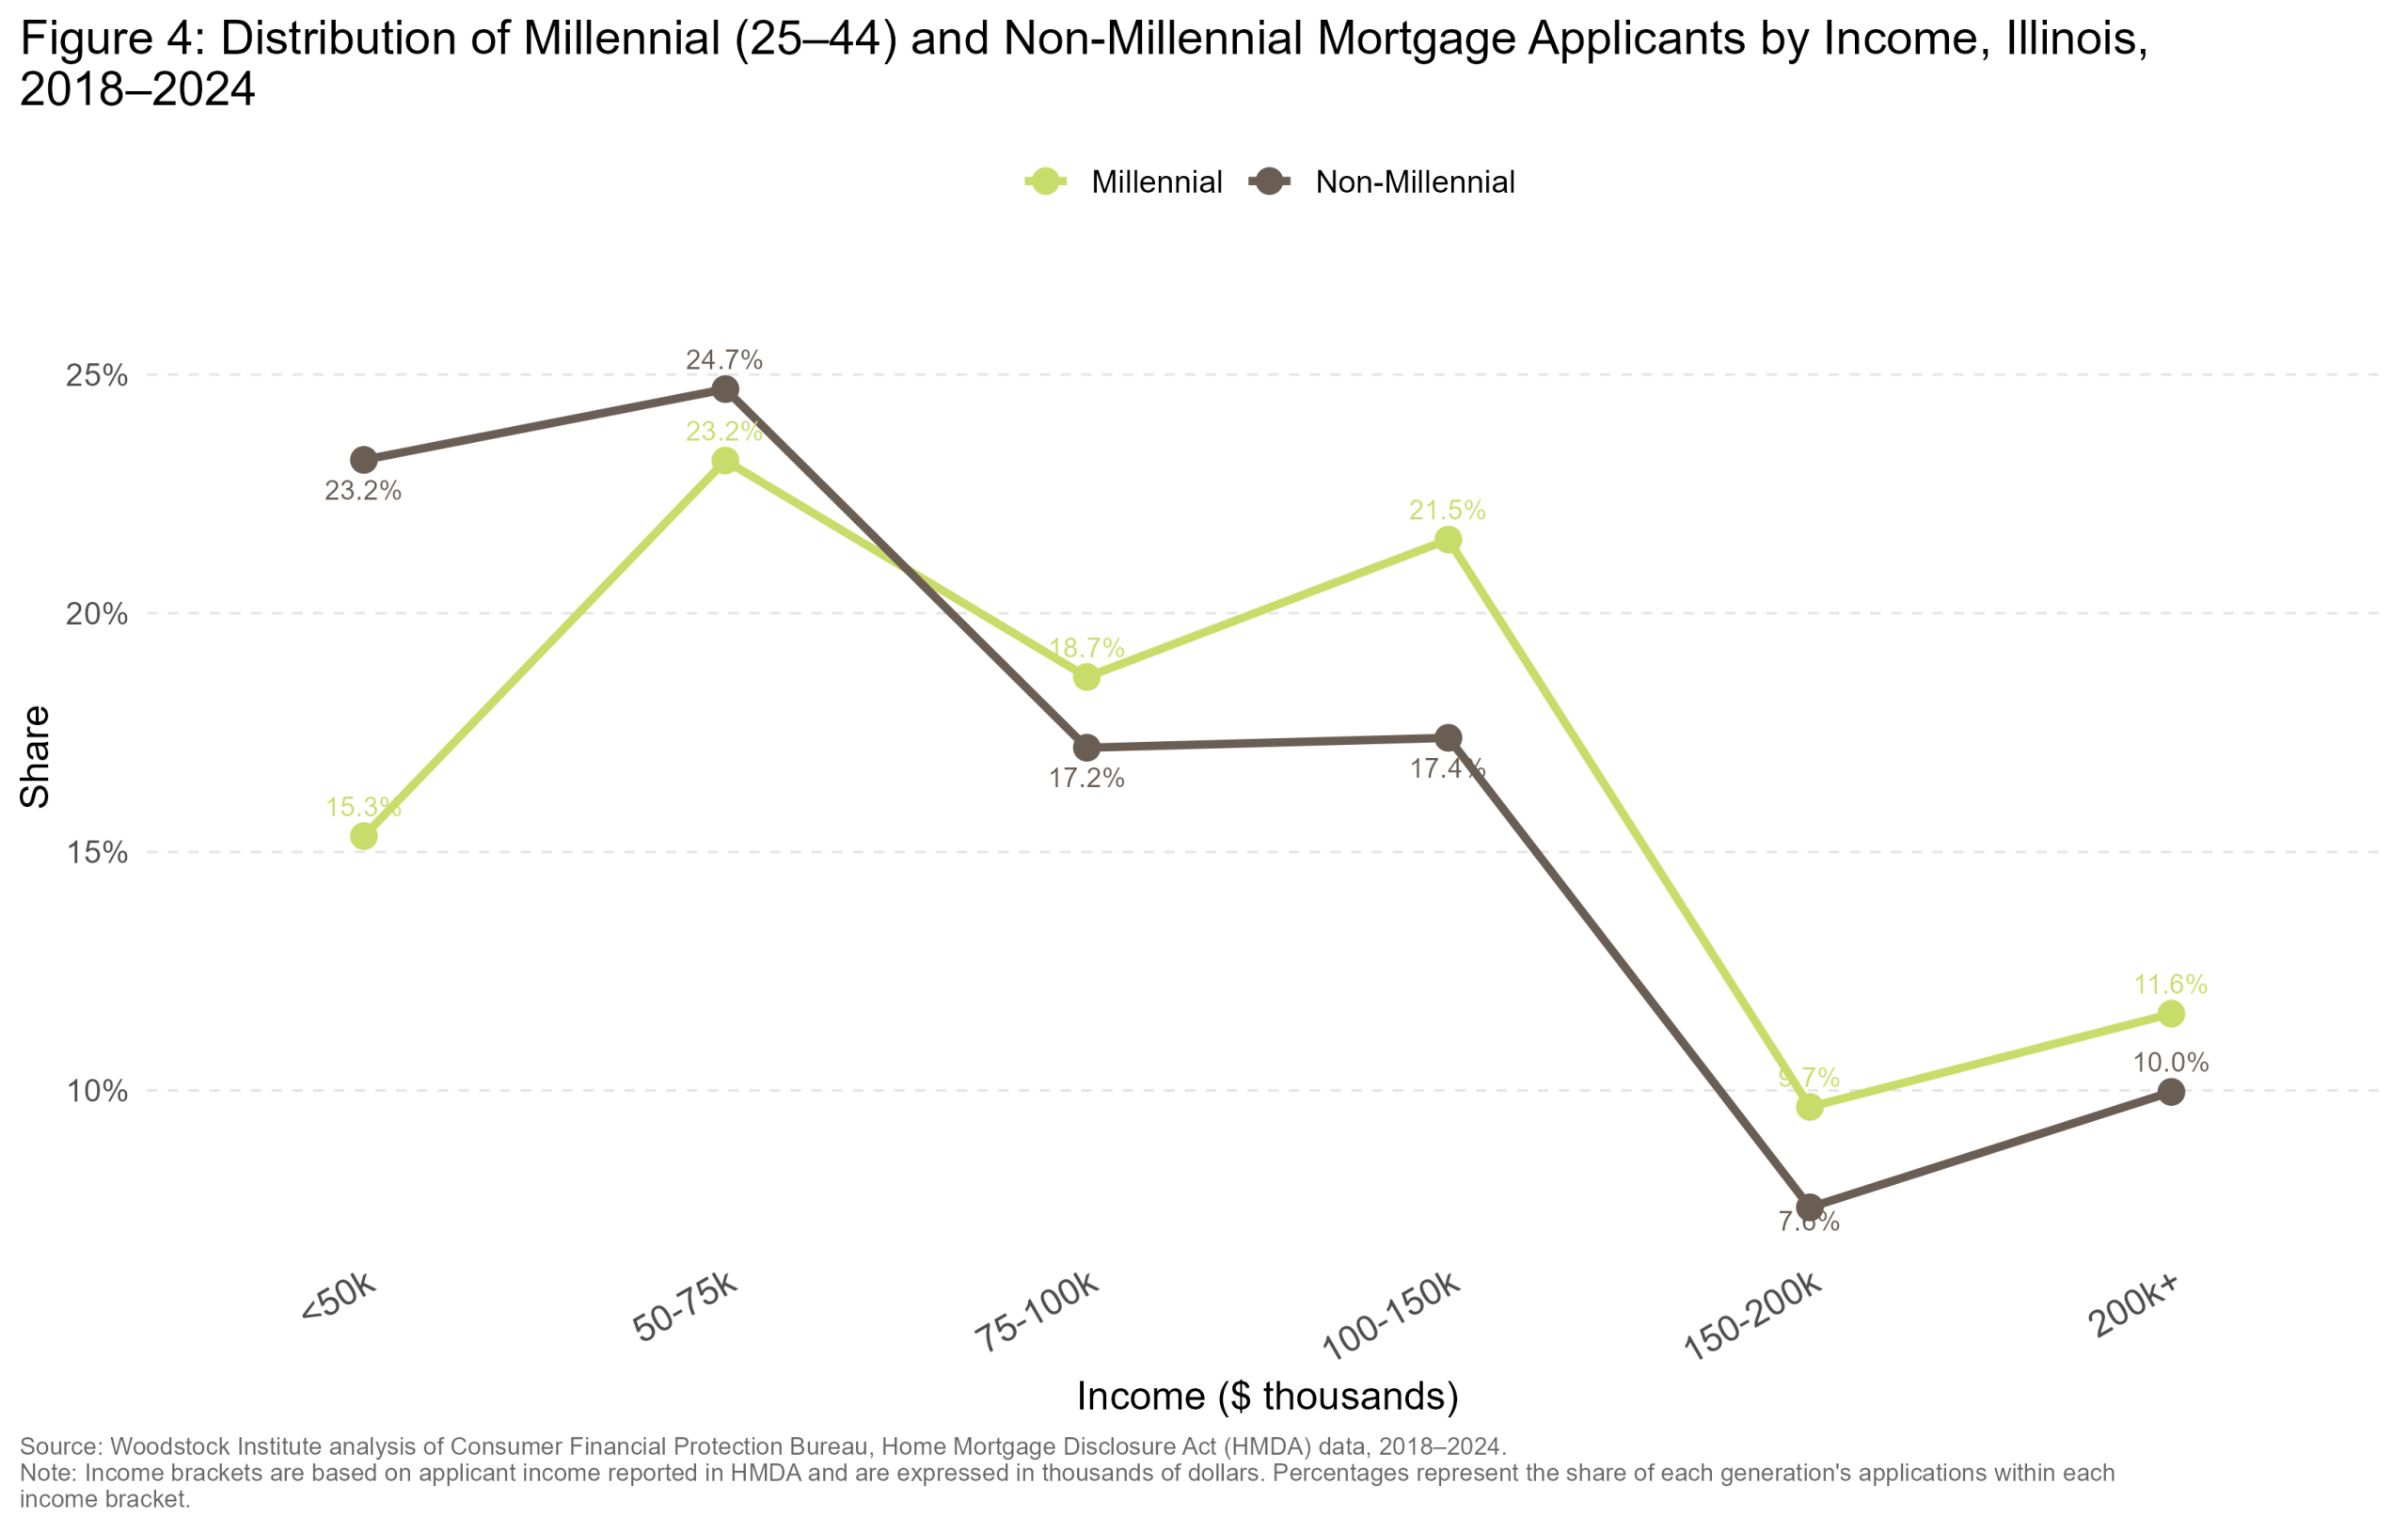
Among mortgage applicants, millennials are more concentrated in higher income brackets than non-millennials. Of those that applied for loans between 2018 and 2024, millennials’ median income surpassed that of non-millennials, starting in the $75,000 to $100,000 bracket and remaining higher in every following income category. (Figure 4)
income-trend-mill-nonmill-1.png / .jpg / .jpegCheck the file exists in the graphs folder and that this HTML is opened from a browser with local file access enabled.
Borrower income
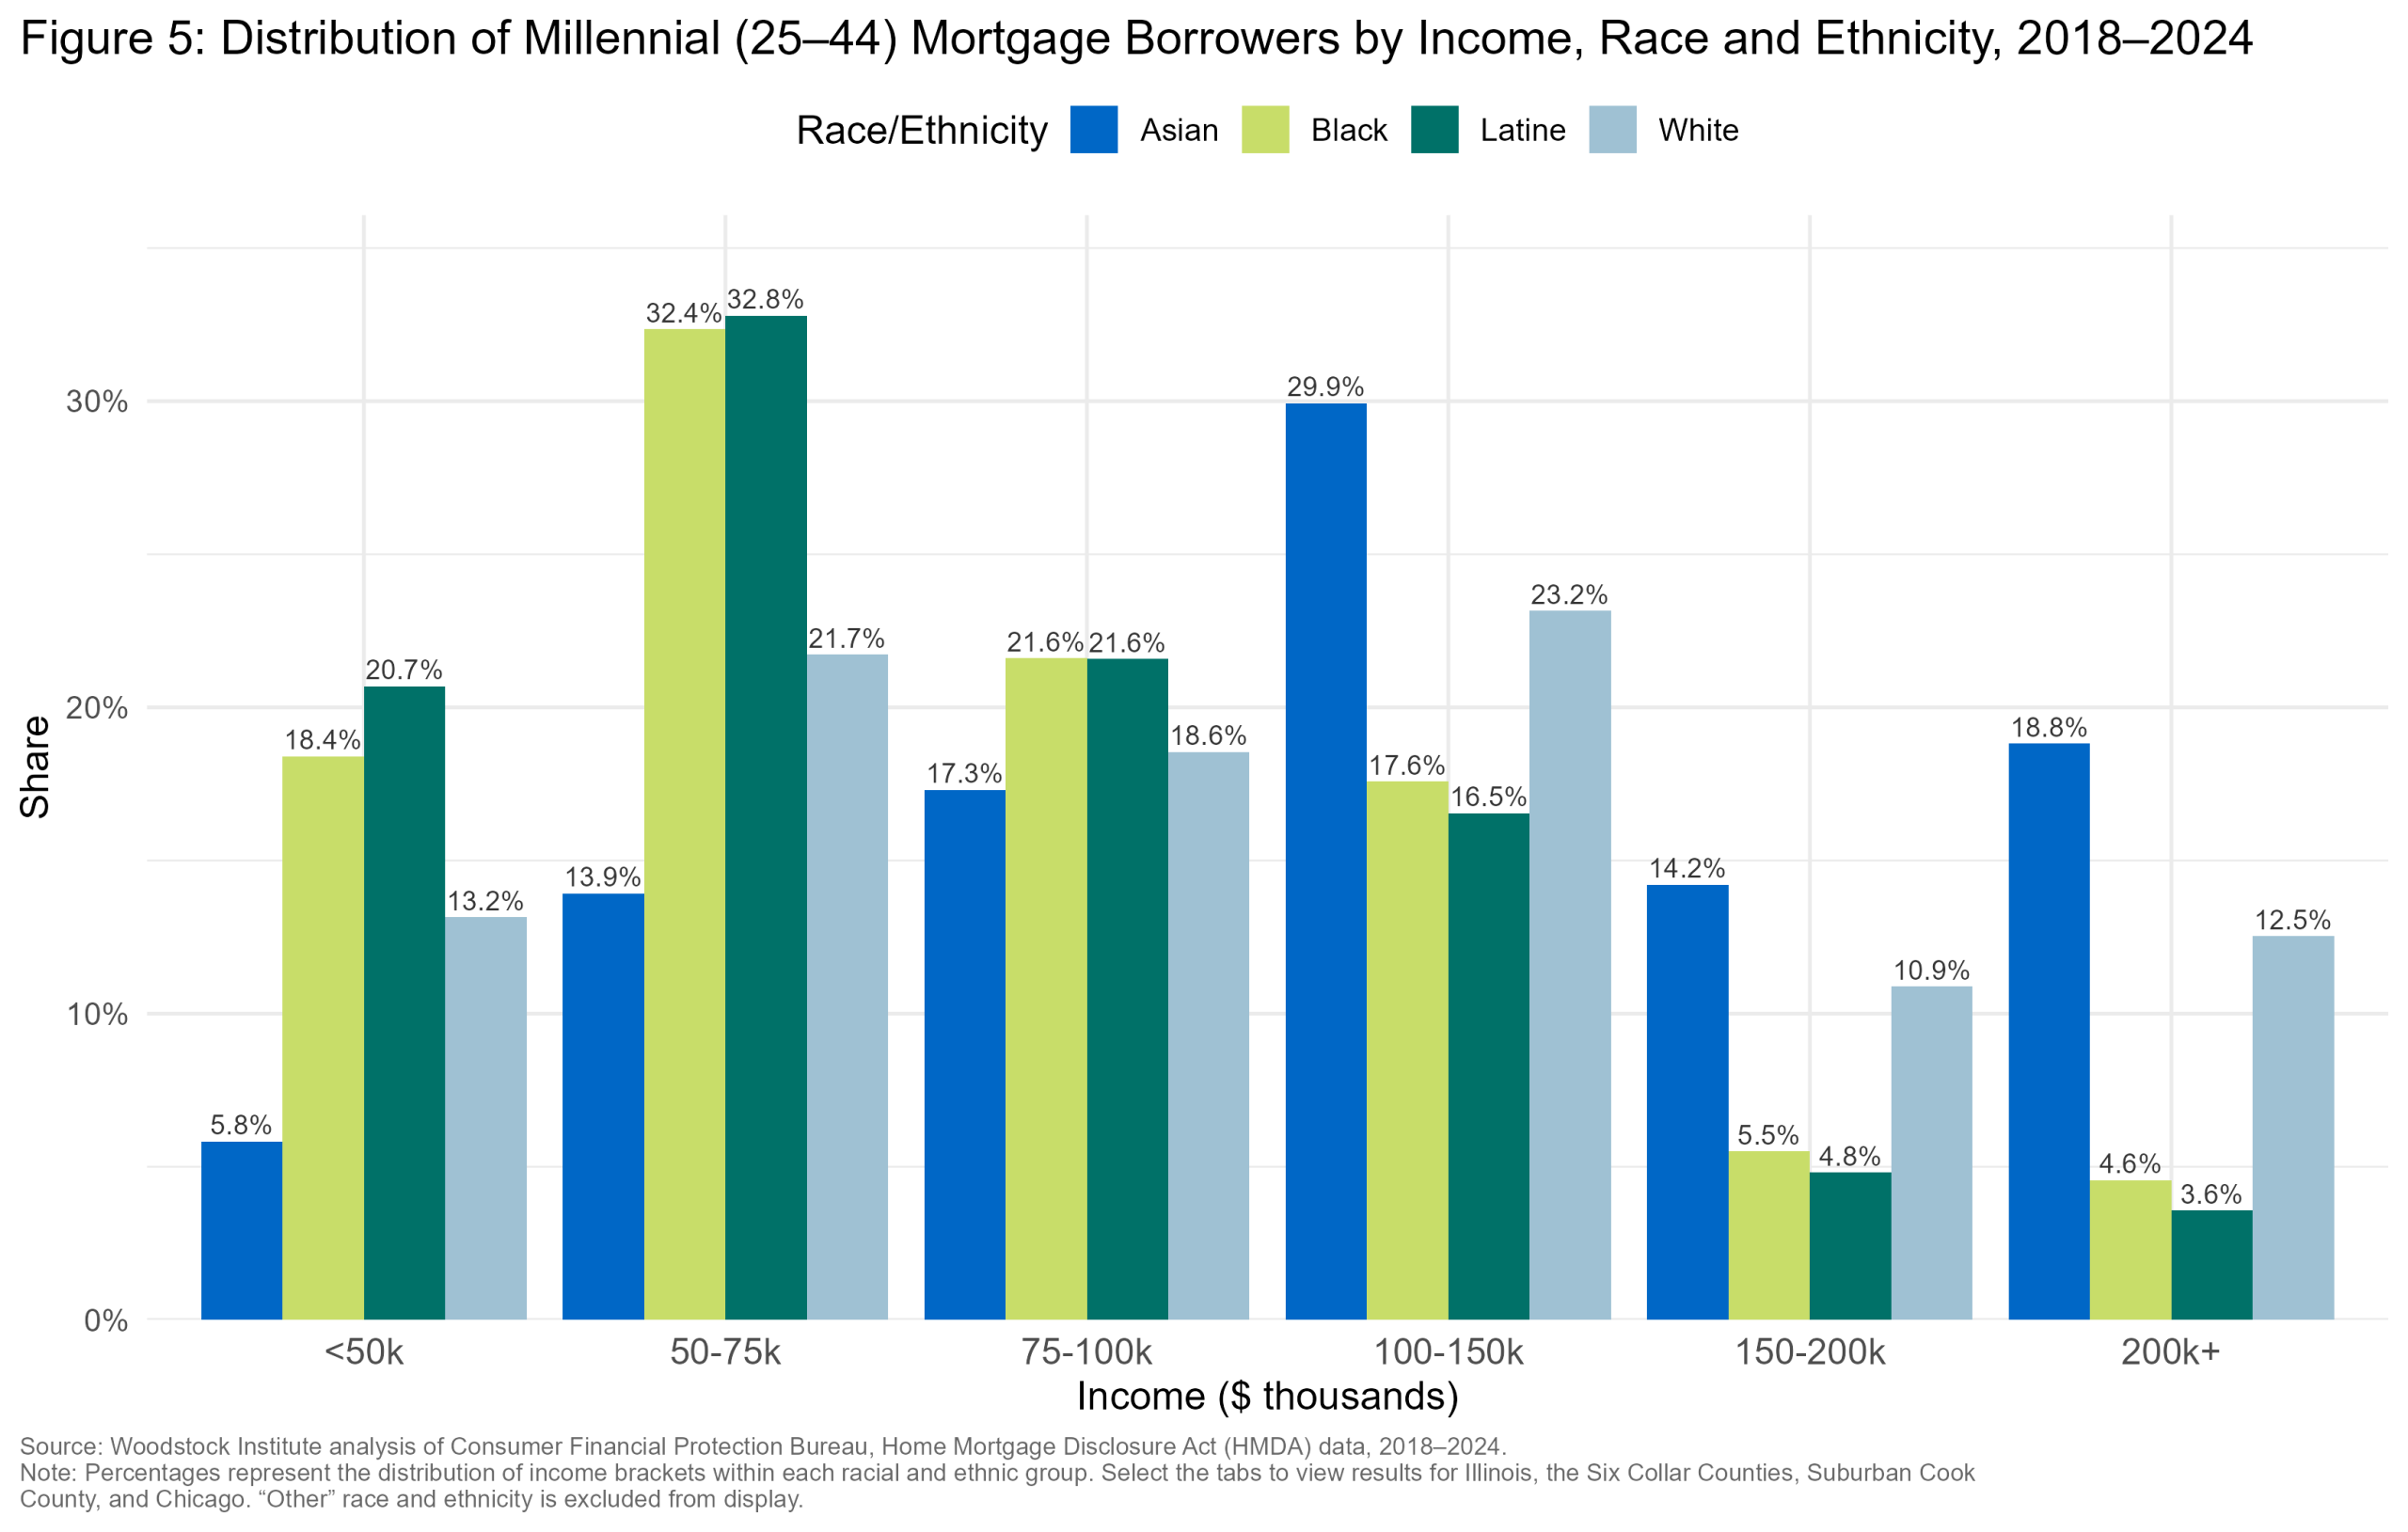
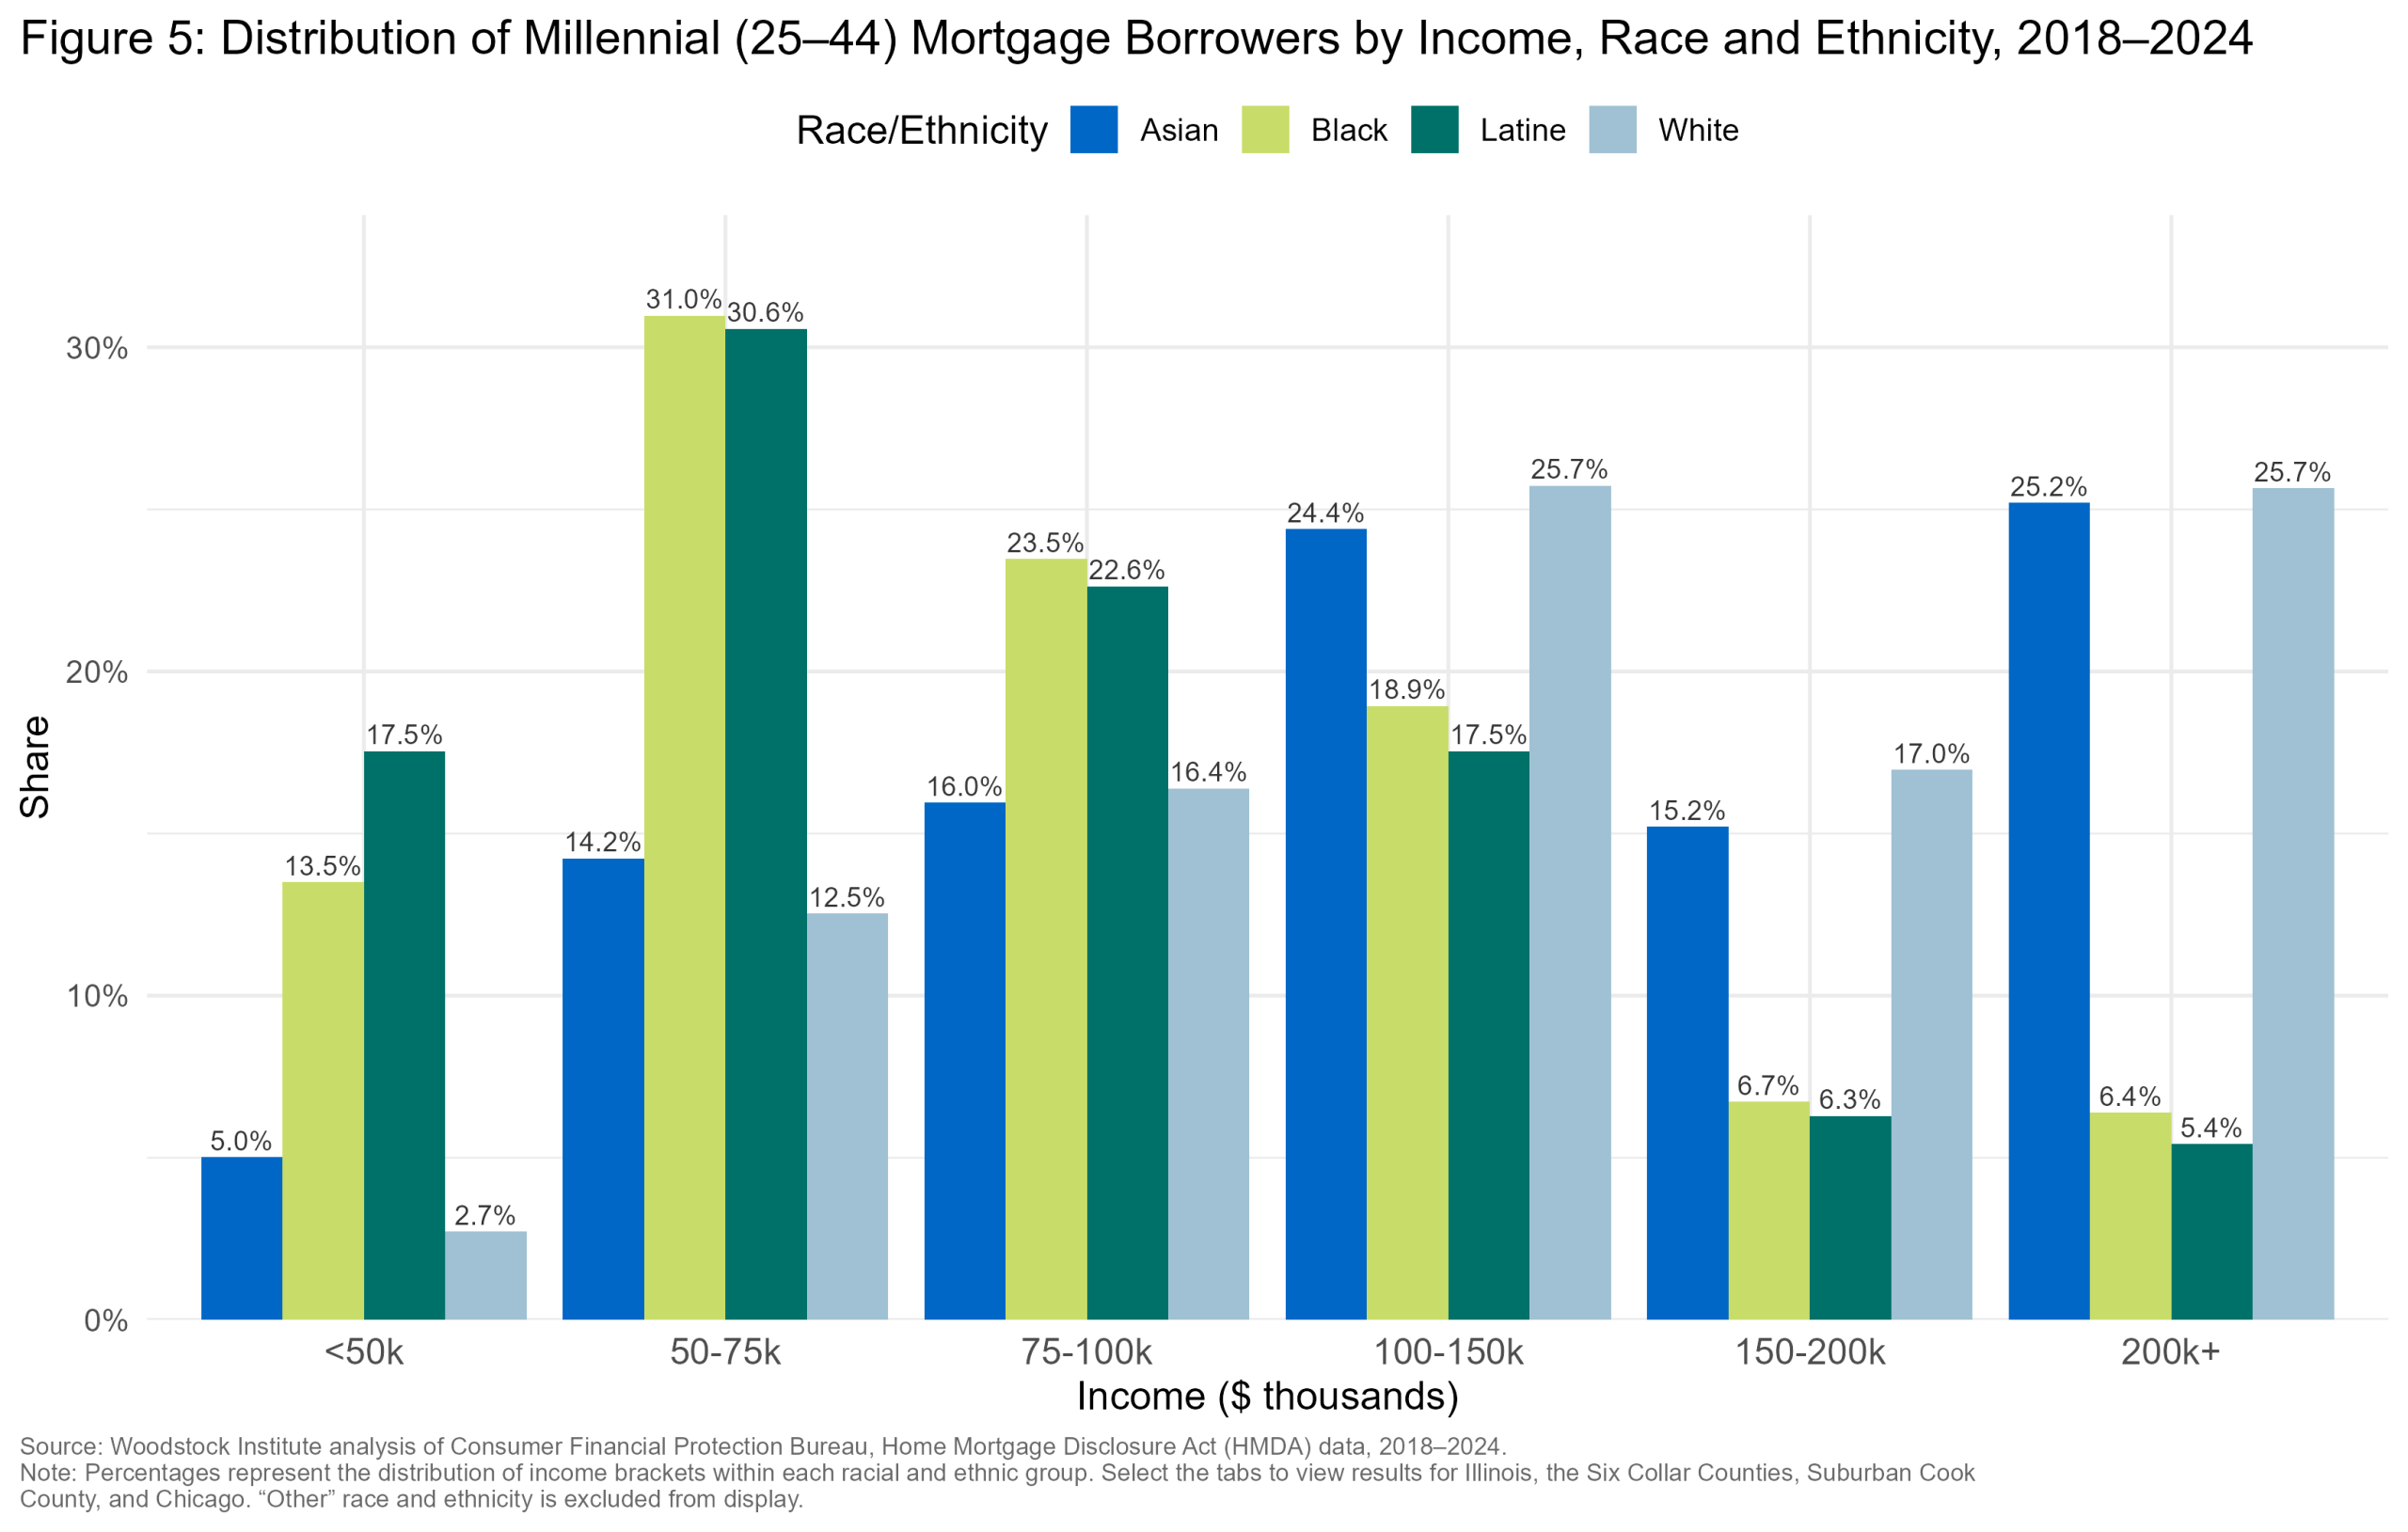
In Illinois, income disparities for millennial borrowers are reflective of historic systemic patterns and the persistent racial wealth gap. Asian millennial borrowers had the highest income out of all groups with over 50 percent earning over $100,000 annually. Asian borrowers’ median income of $119,000 outpaced White borrowers’ median income by $25,000, the group with the second-highest income statewide. Nearly half of White borrowers reported income was above $100,000, with a strong concentration between $100,000 and $150,000. Black and Latine millennial borrowers had similar income distributions concentrated in middle-income ranges, with roughly a third of borrowers earning between $50,000 and $75,000, the largest share of any income category. Over half of Black and Latine borrowers earn less than $75,000 compared to roughly 35 percent and 20 percent of White and Asian borrowers, respectively. High-income borrowers were less common among Black and Latine millennials, with Black borrowers having a slightly higher share than Latine. Only a small share (less than five percent) of borrowers in either group reported income above $200,000, compared with much larger shares among White and especially Asian borrowers. (Figure 5)
plot_mill_income_race_Illinois.png / .jpg / .jpegCheck the file exists in the graphs folder and that this HTML is opened from a browser with local file access enabled.
plot_mill_income_race_Six_Collar.png / .jpg / .jpegCheck the file exists in the graphs folder and that this HTML is opened from a browser with local file access enabled.
plot_mill_income_race_Suburban_Cook.png / .jpg / .jpegCheck the file exists in the graphs folder and that this HTML is opened from a browser with local file access enabled.
plot_mill_income_race_Chicago.png / .jpg / .jpegCheck the file exists in the graphs folder and that this HTML is opened from a browser with local file access enabled.
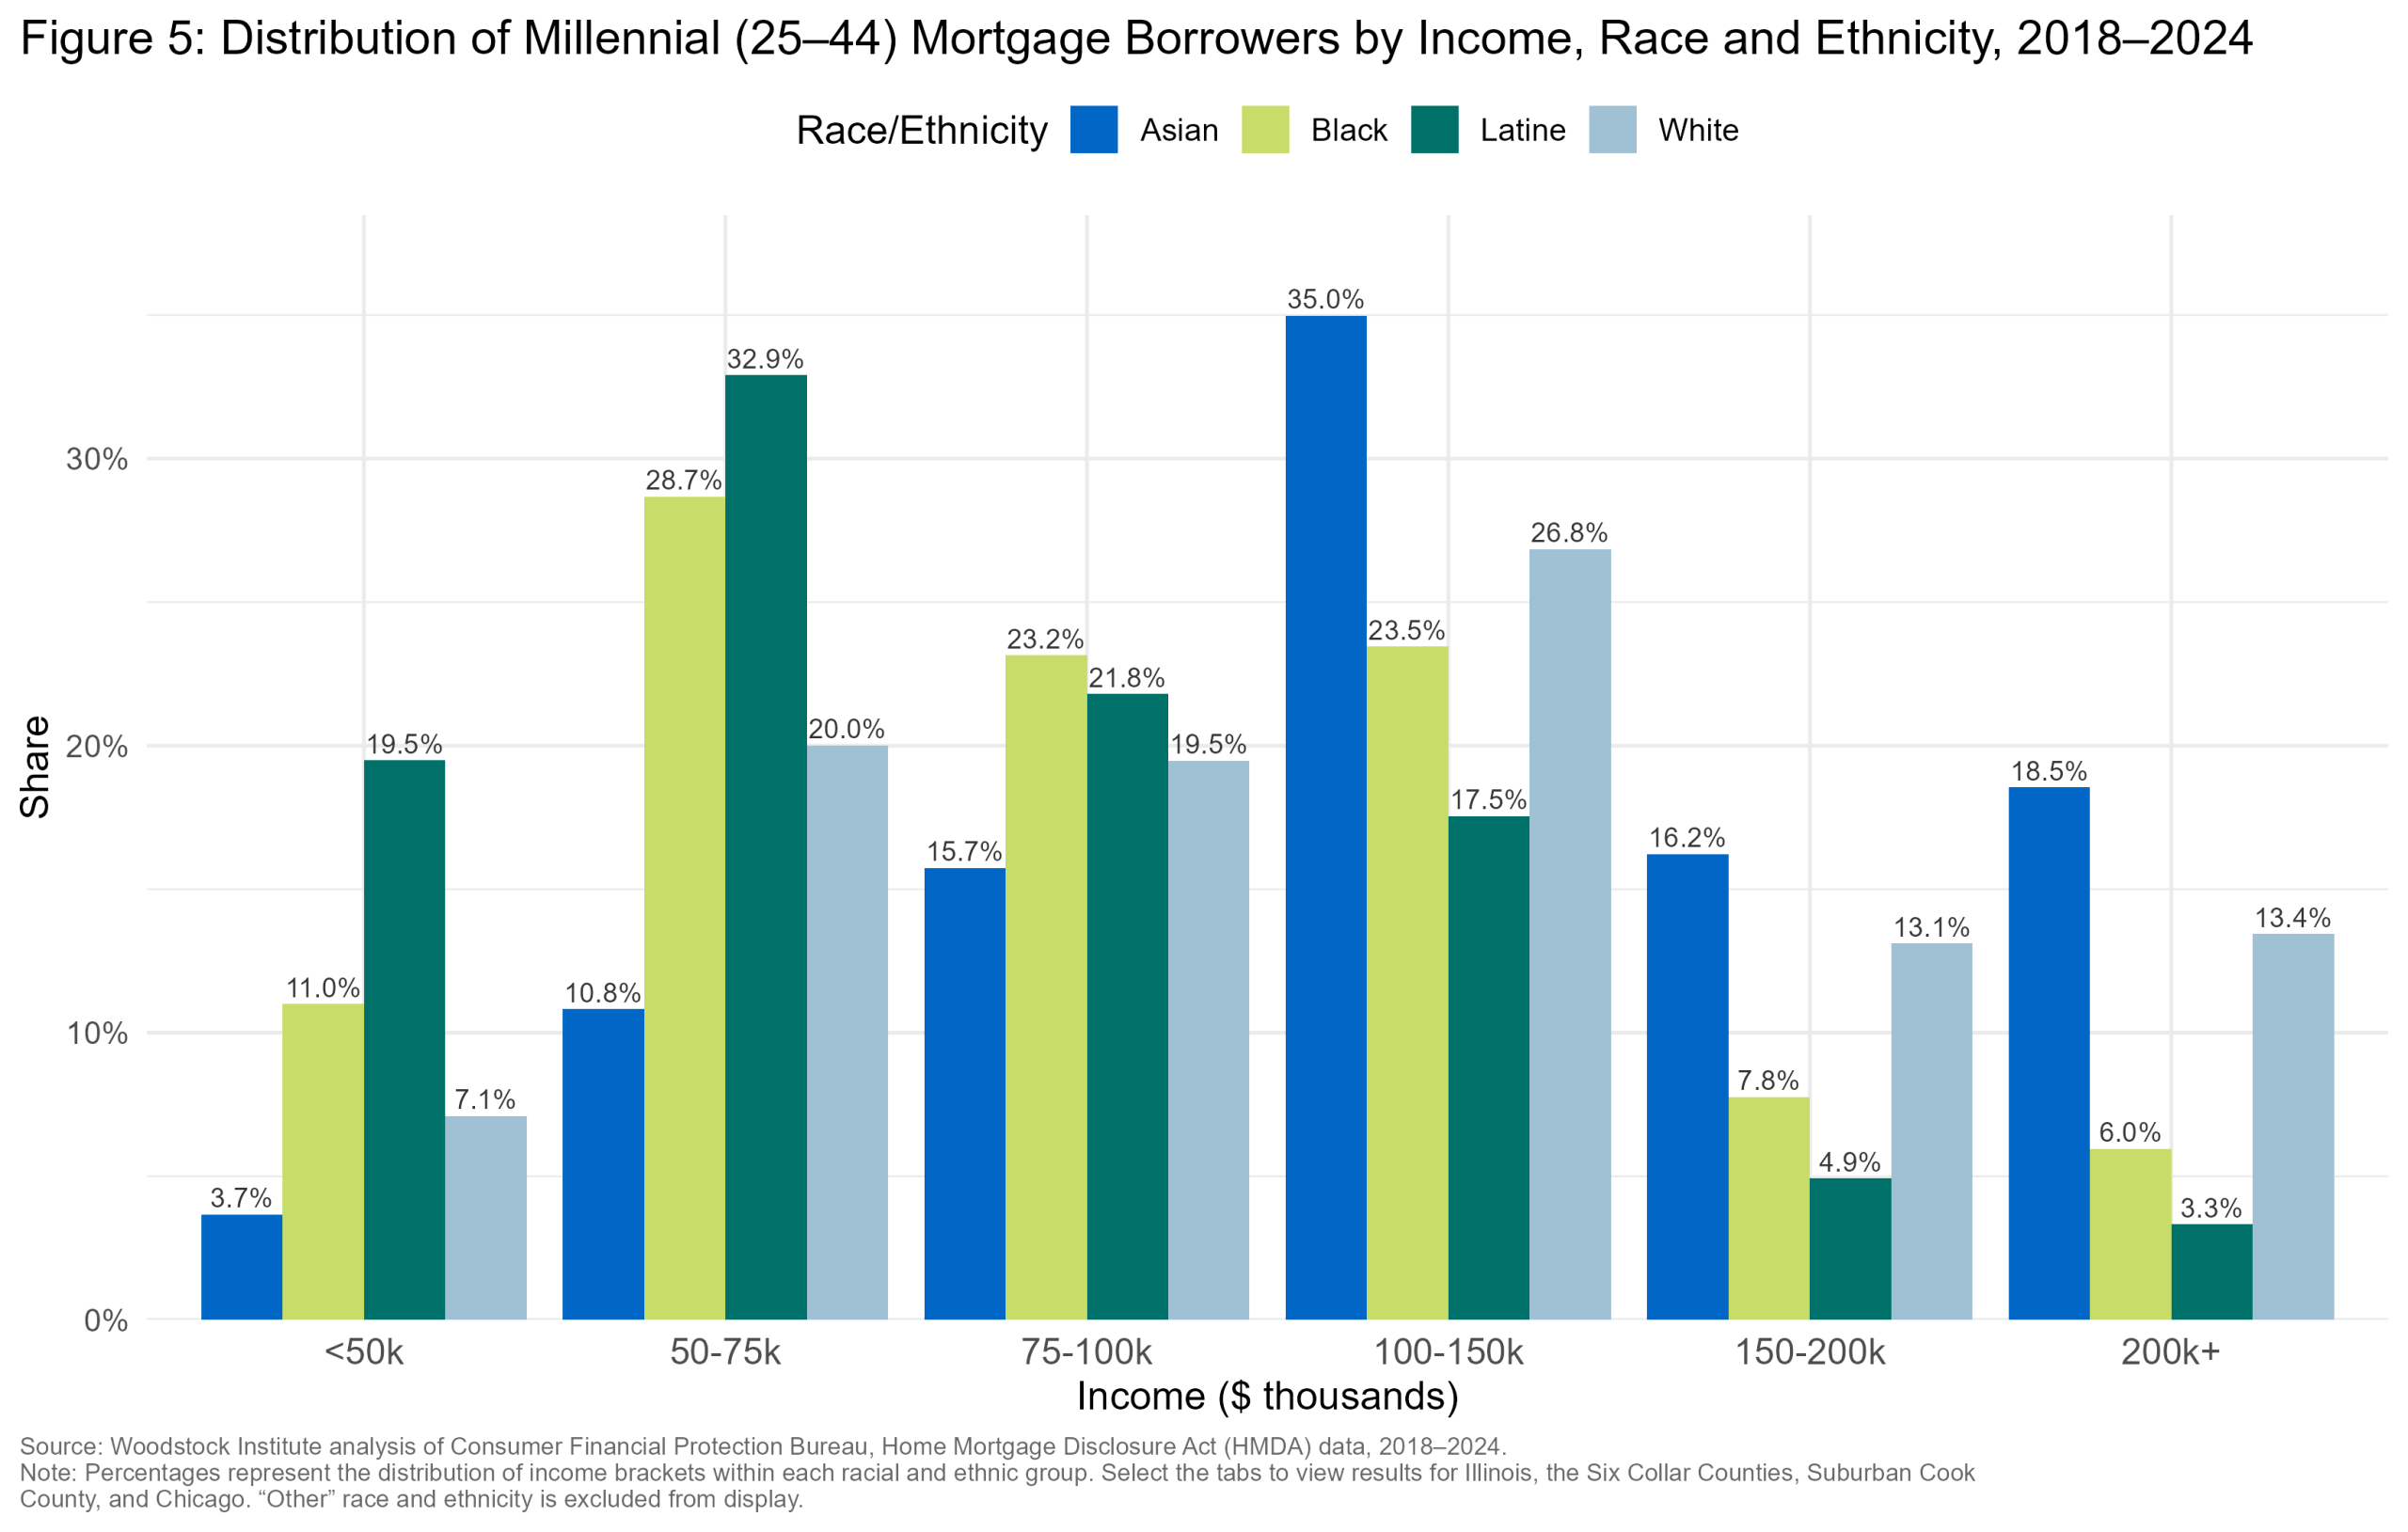
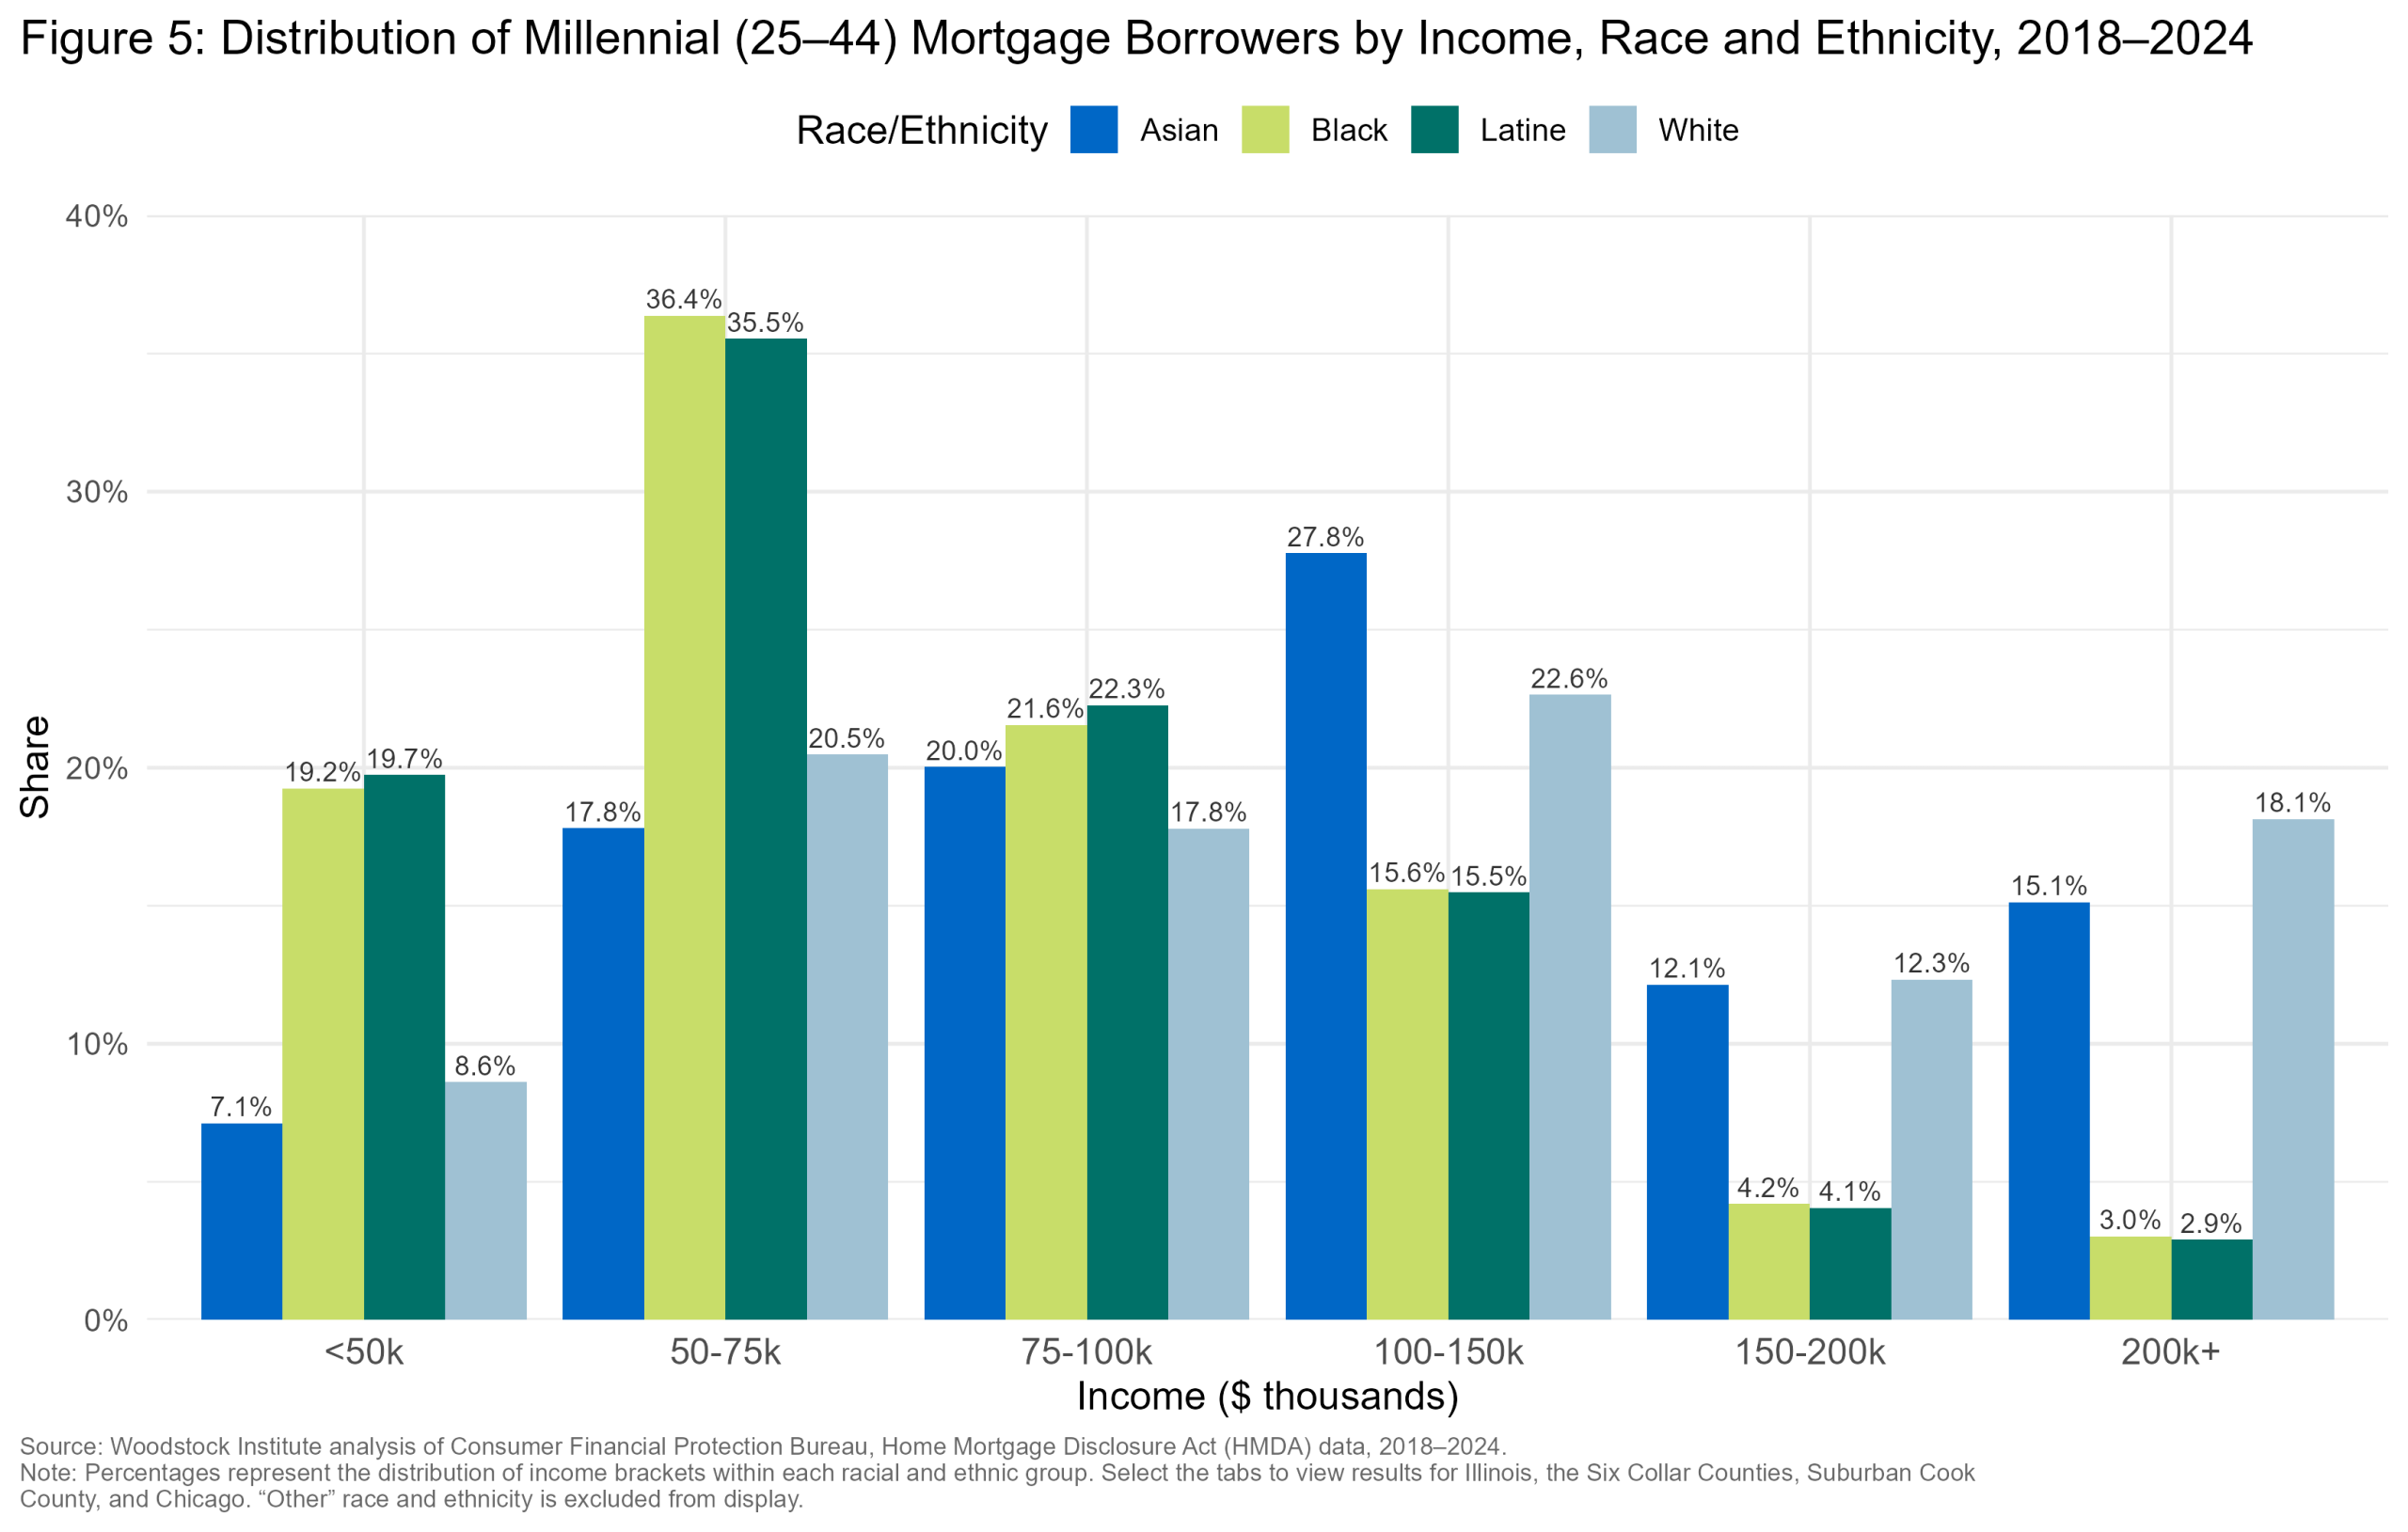
This pattern holds consistently across Chicago, suburban Cook County, and the six collar counties, as Black and Latine millennial borrowers remain concentrated in the $50,000 to $75,000 bracket in every submarket, even where overall incomes skew more affluent, such as the collar counties. In Chicago, Latine borrowers earned a median of $76,000, only slightly lower than Black applicants at $79,000, while White borrowers earned a median of $132,000. Suburban Cook County shows the highest income disparity, with over 35 percent of Black and Latine applicants concentrated in that $50,000 to $75,000 bracket, and the lowest median income for Black borrowers of any geography, at $70,000. These income disparities shape purchasing power. (Figure 5)
Understanding borrowers’ resources that are committed to debt, initial equity, and value of property purchased provides additional insight into the financial fragility of borrowers. The following section provides additional context.
Applicant debt-to-income (DTI), sources of debt, and combined loan-to-value (CLTV) ratios
Debt-to-income (DTI) and combined loan-to-value (CLTV) ratios build on the income findings by showing how much financial pressure borrowers face. The DTI ratio indicates a borrower’s total monthly debt relative to their monthly income. Banks consider a 36 to 43 percent DTI ratio acceptable for standard loans, while 43 to 50 percent are considered higher risk, usually needing government-secured Federal Housing Administration (FHA) or Veterans Affairs (VA) loans, which are dependent on military service. Borrowers with a DTI ratio of 50 percent and higher need more interventions, potentially indicating higher financial fragility and potential inability to pay back debt, which may result in higher upfront costs and increased risks to institutions. CLTV ratios measure the property’s total mortgage debt against its market value, assessing equity. Borrowers are able to lower their CLTV with a higher down payment.
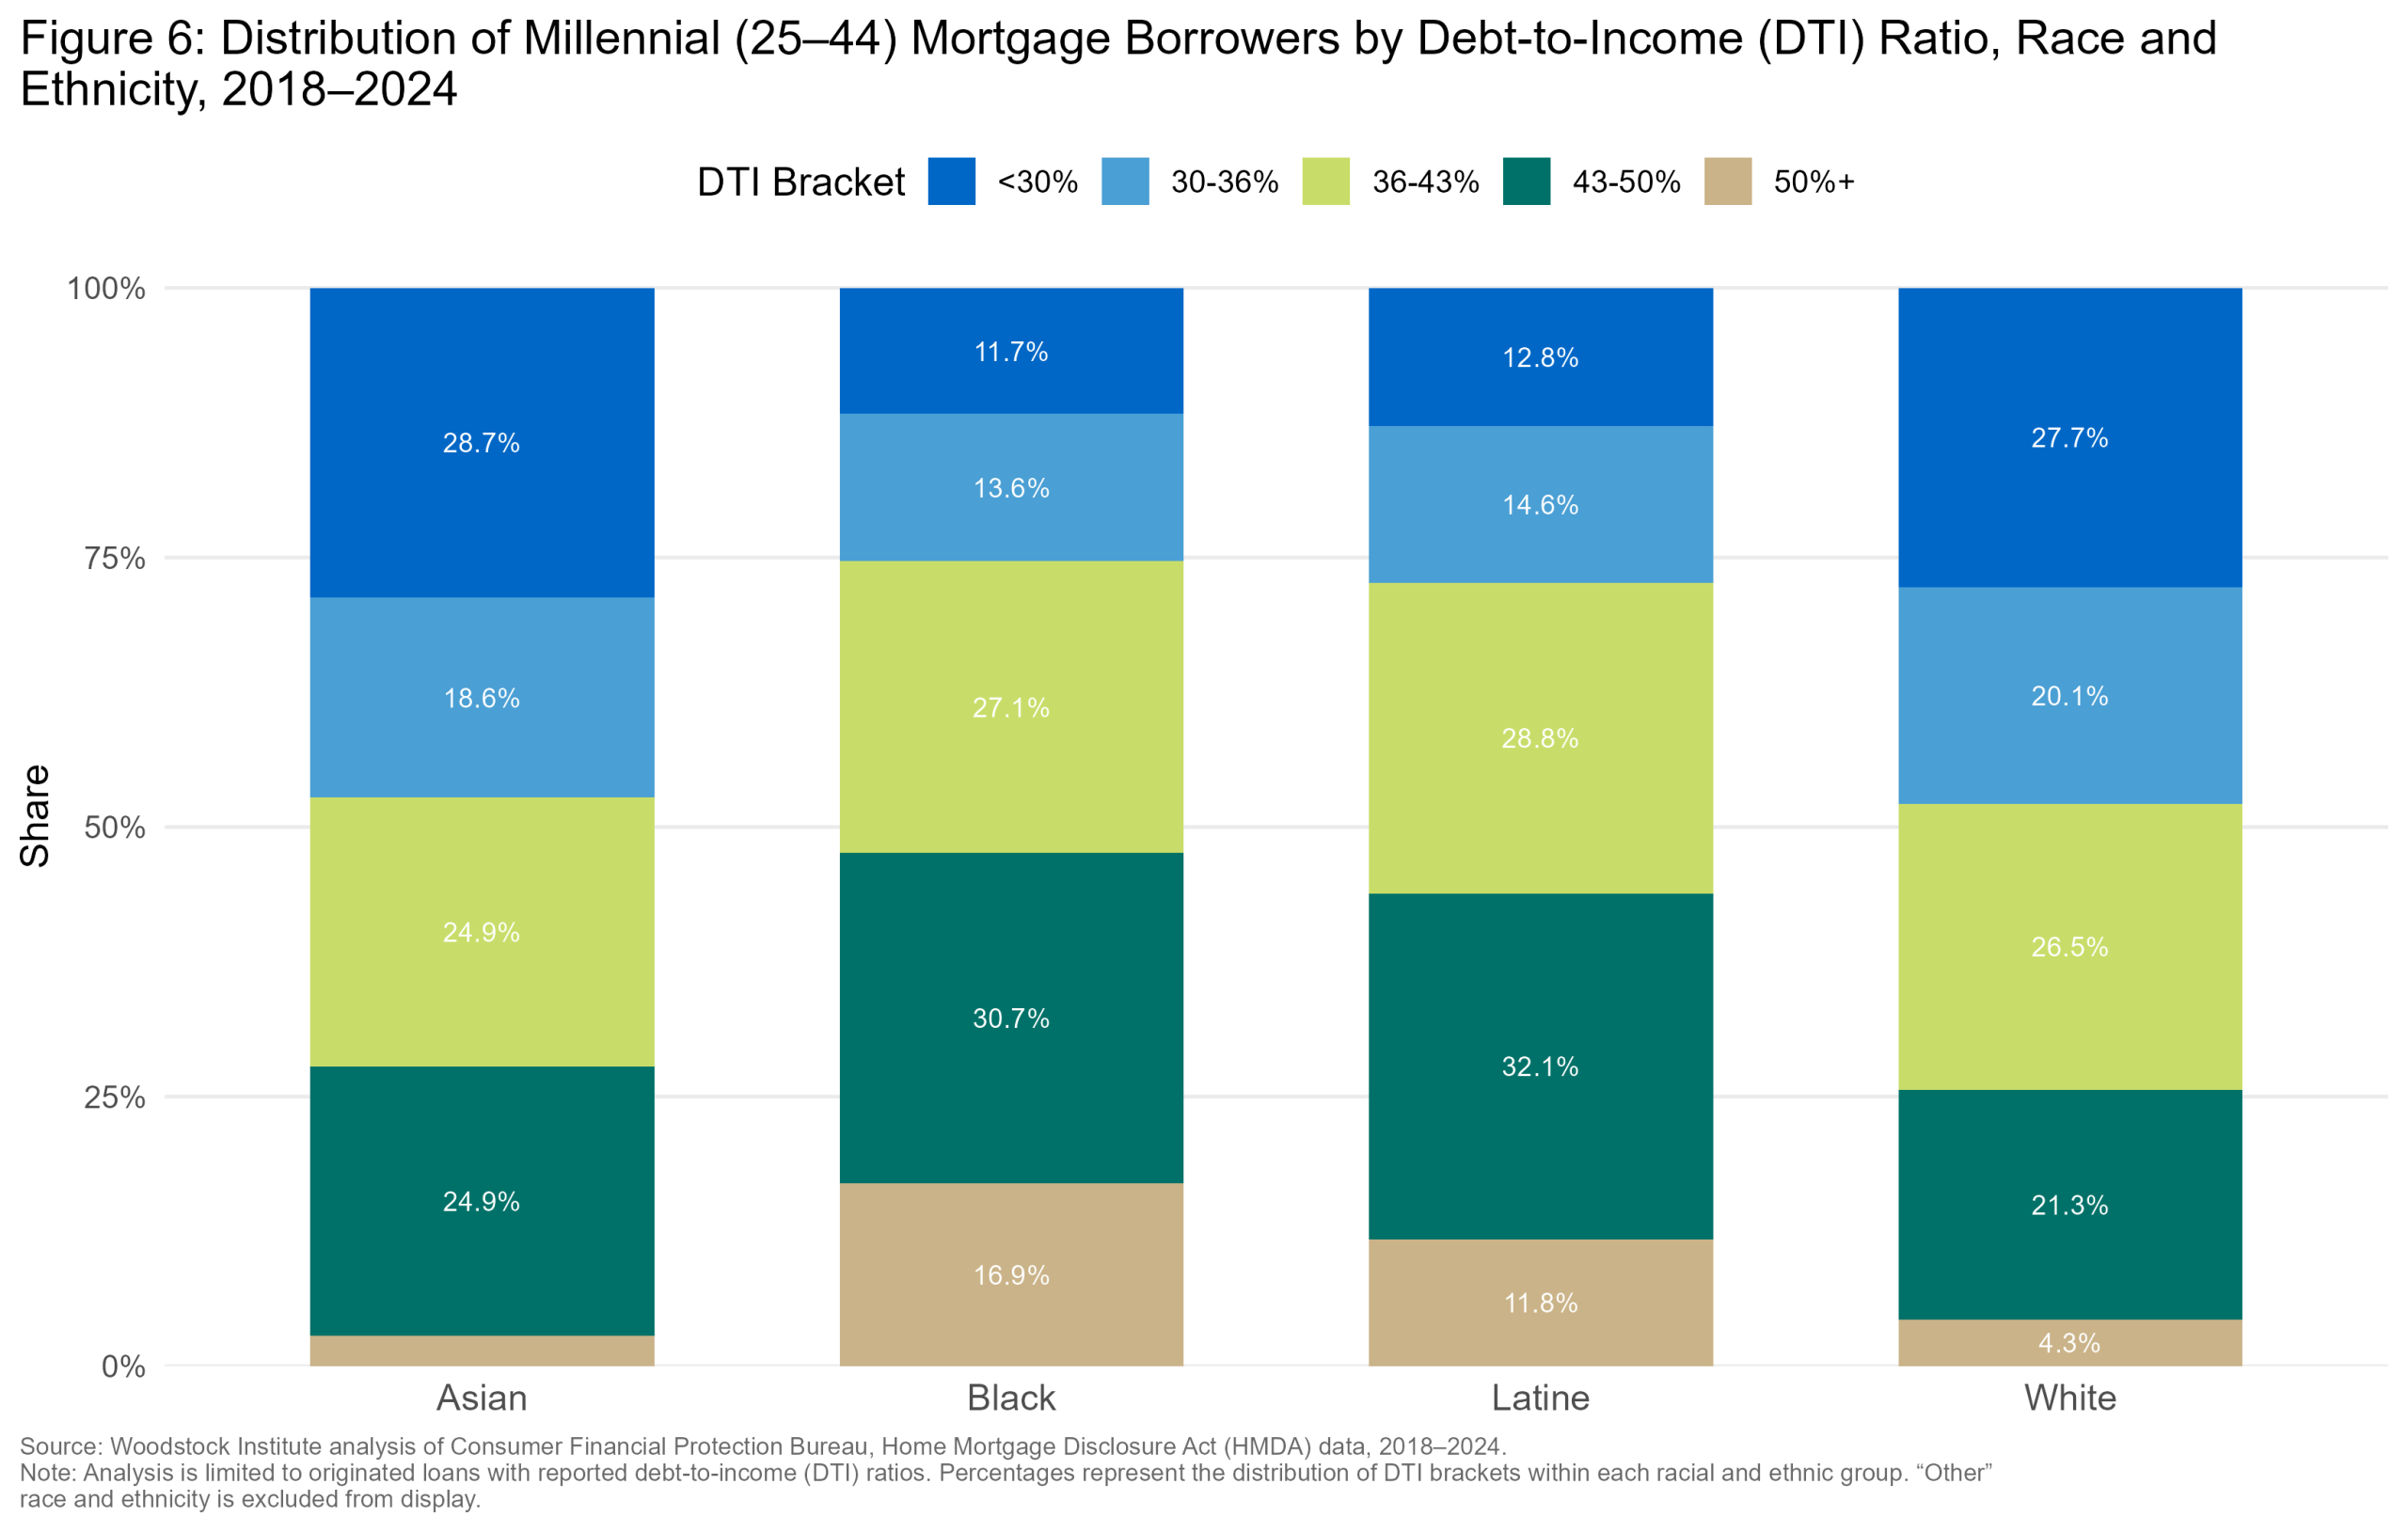
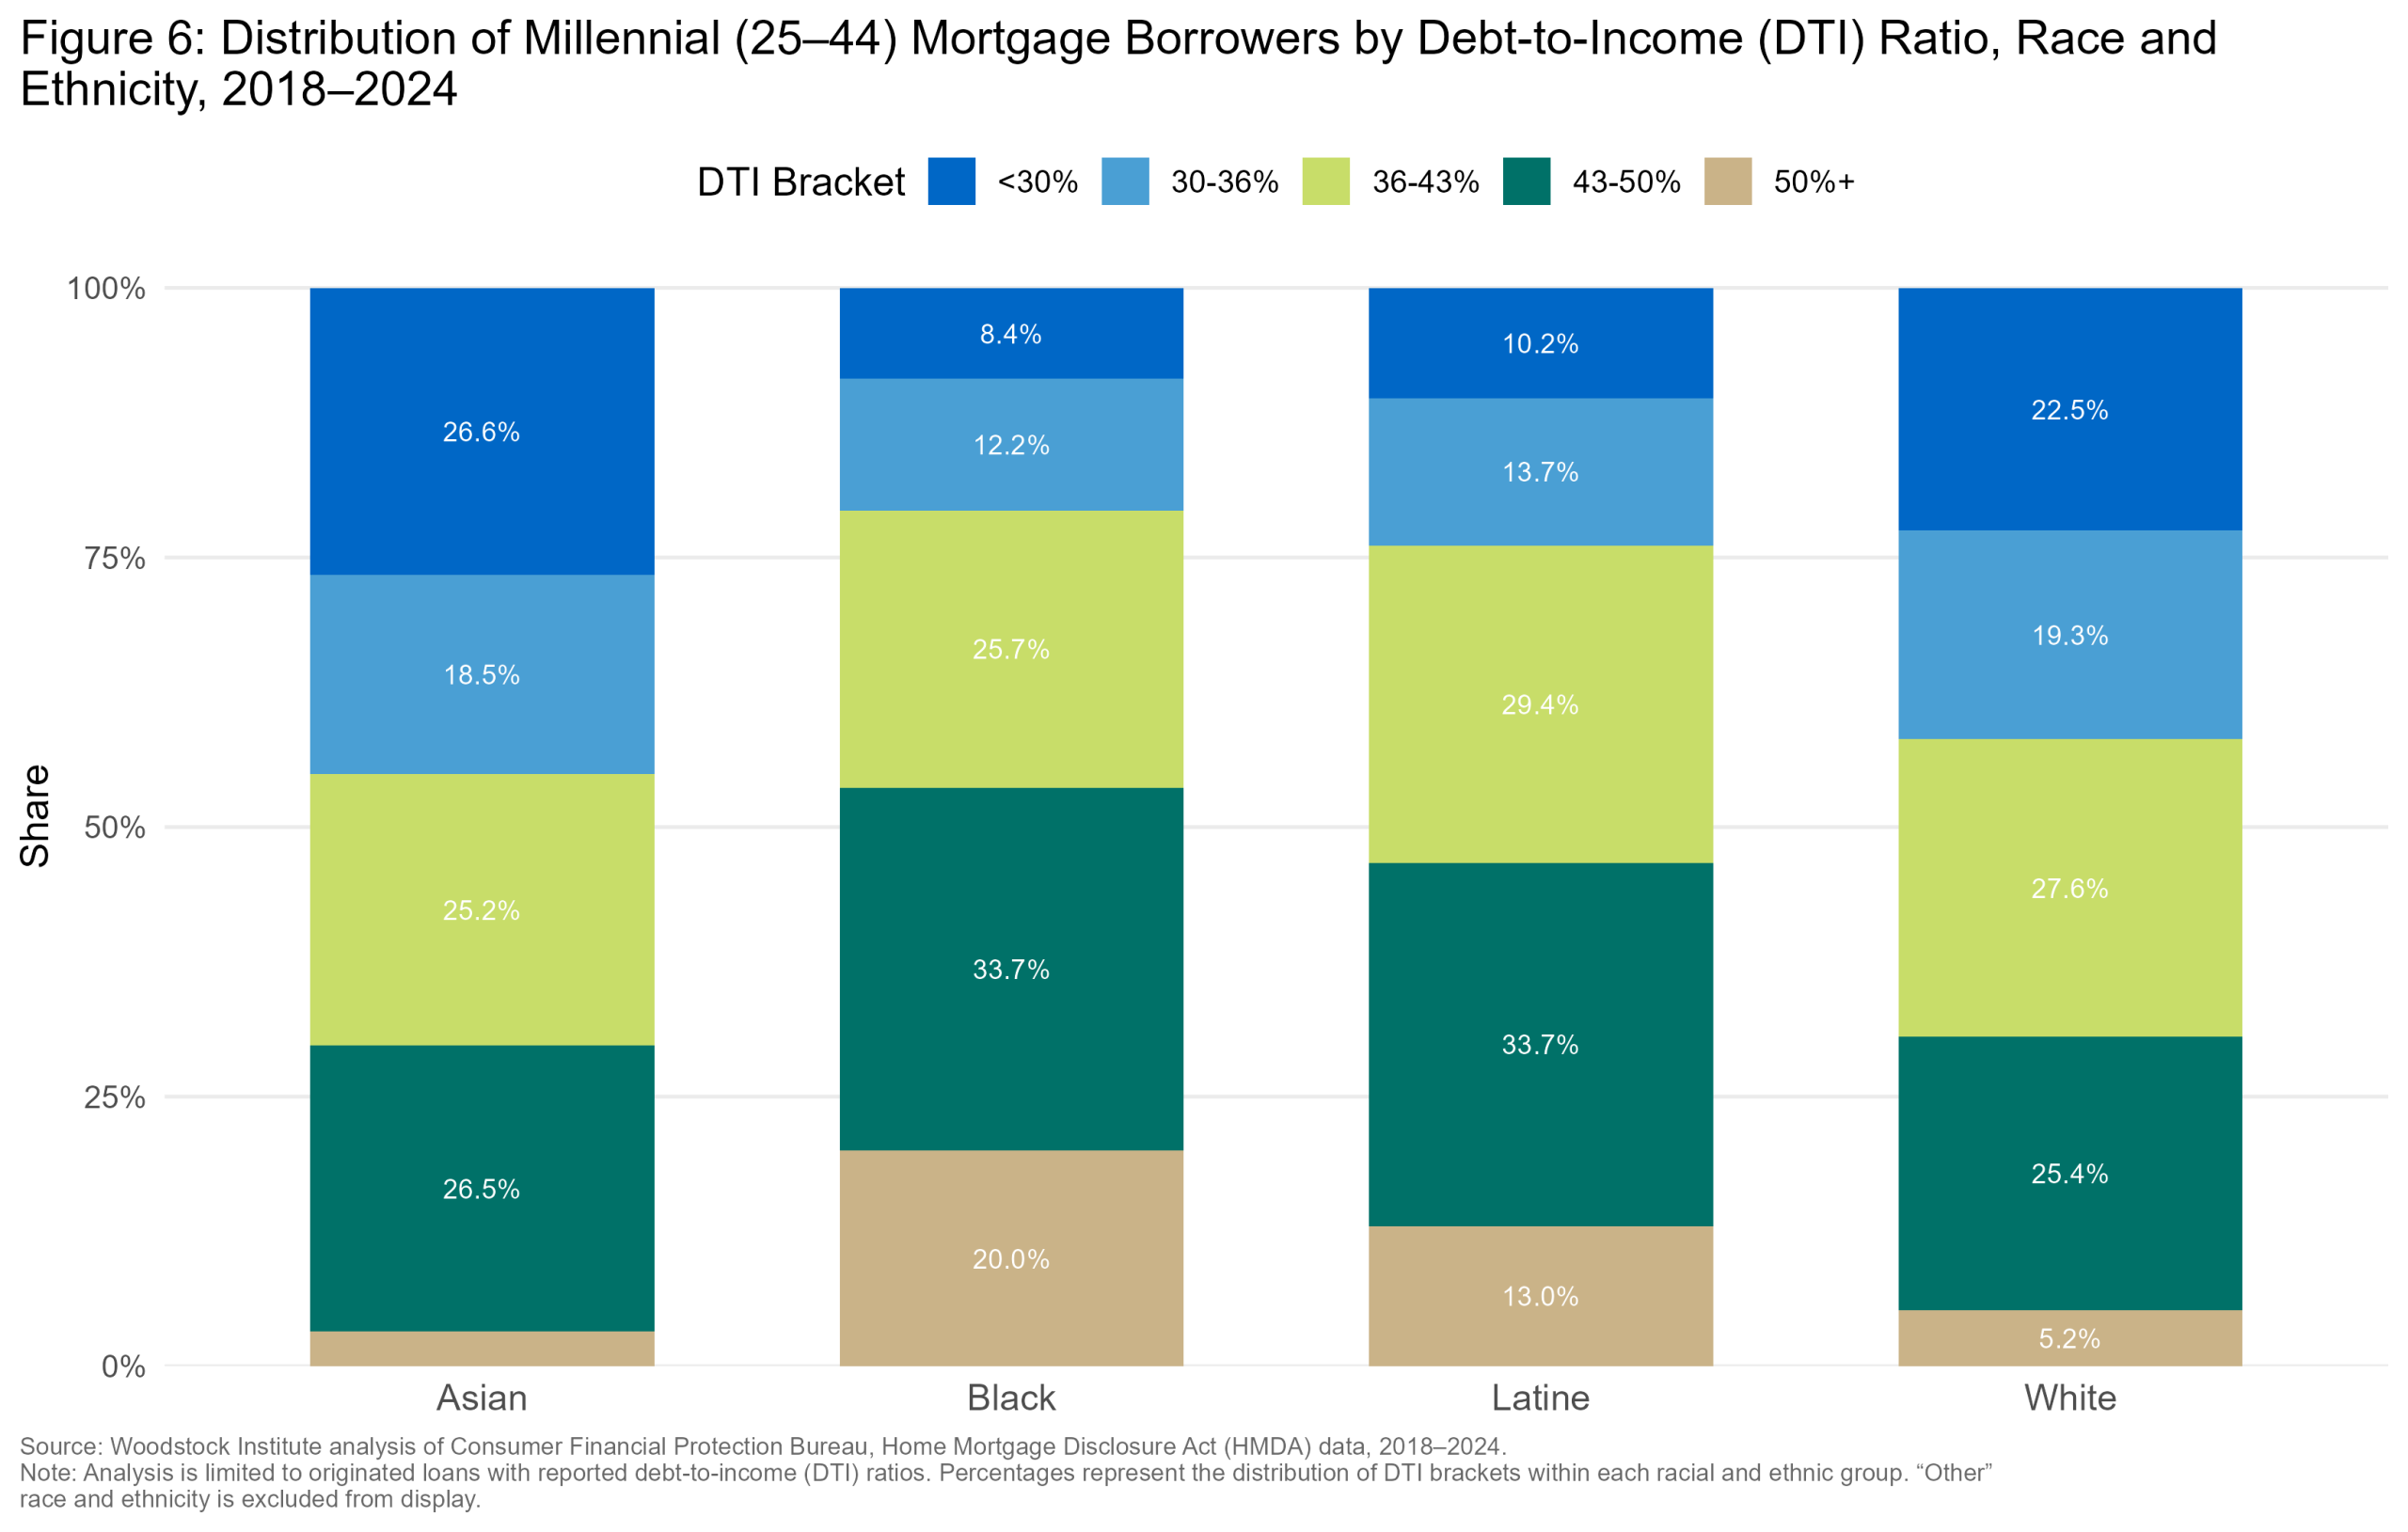
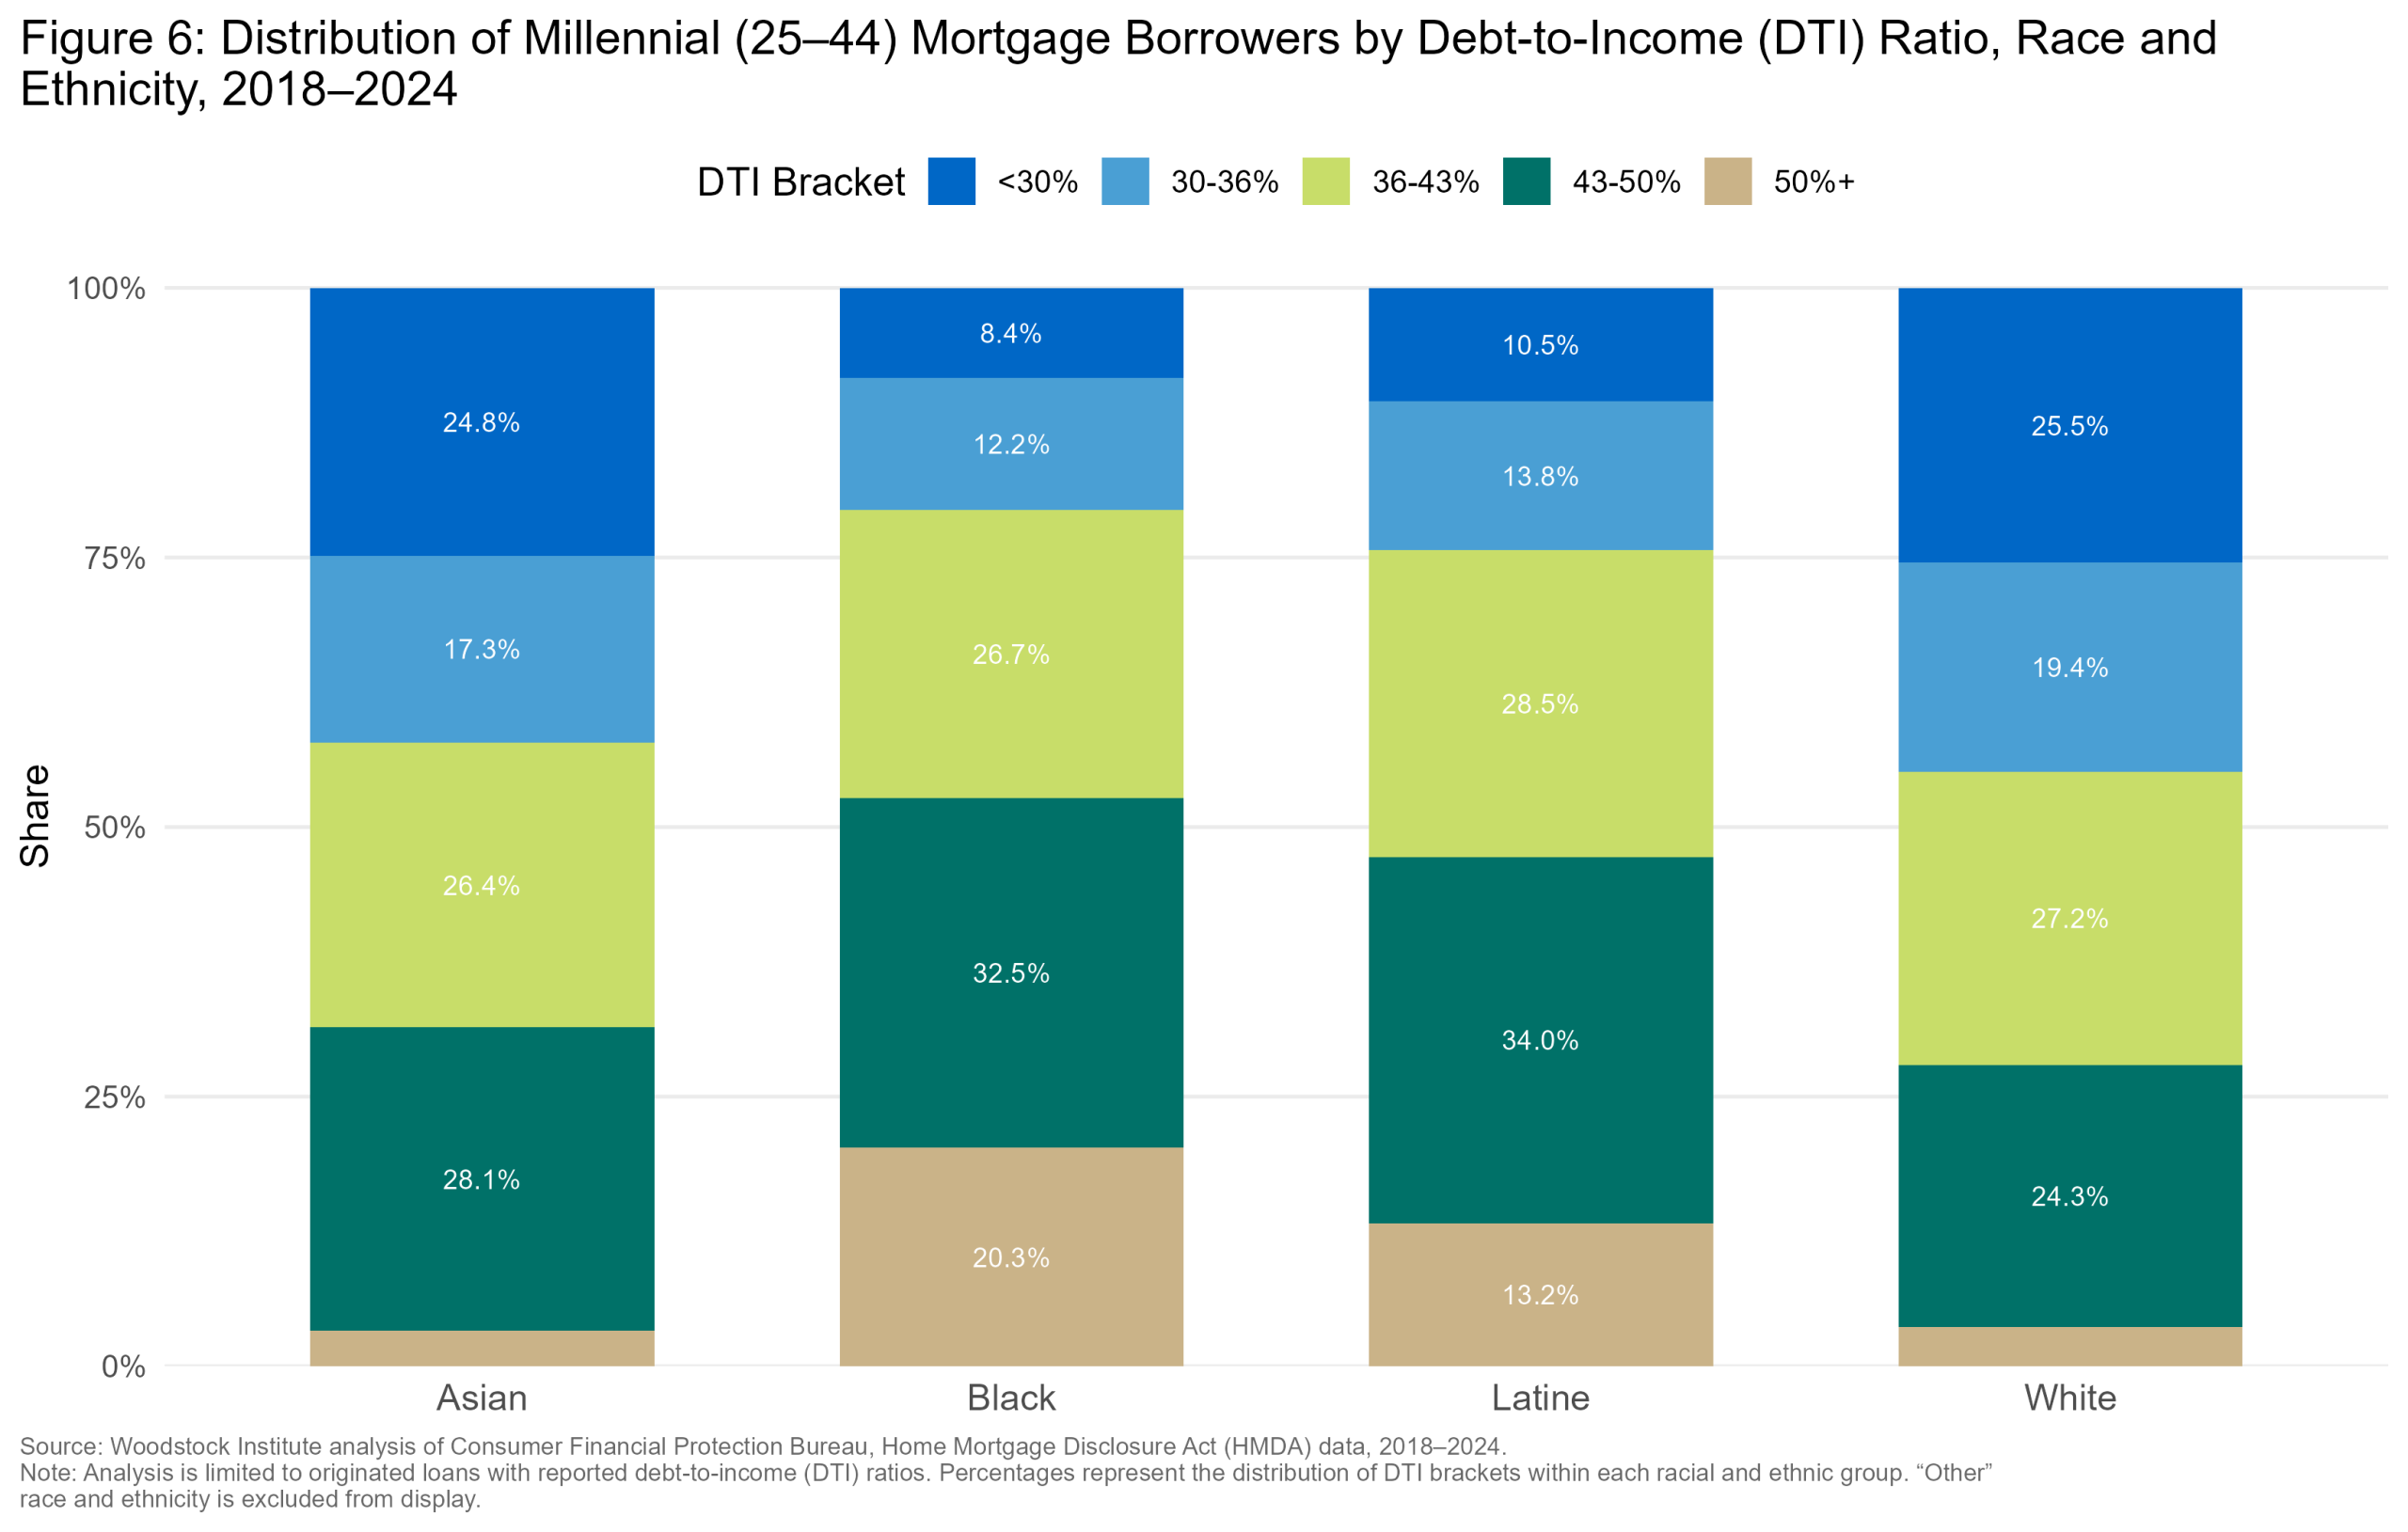
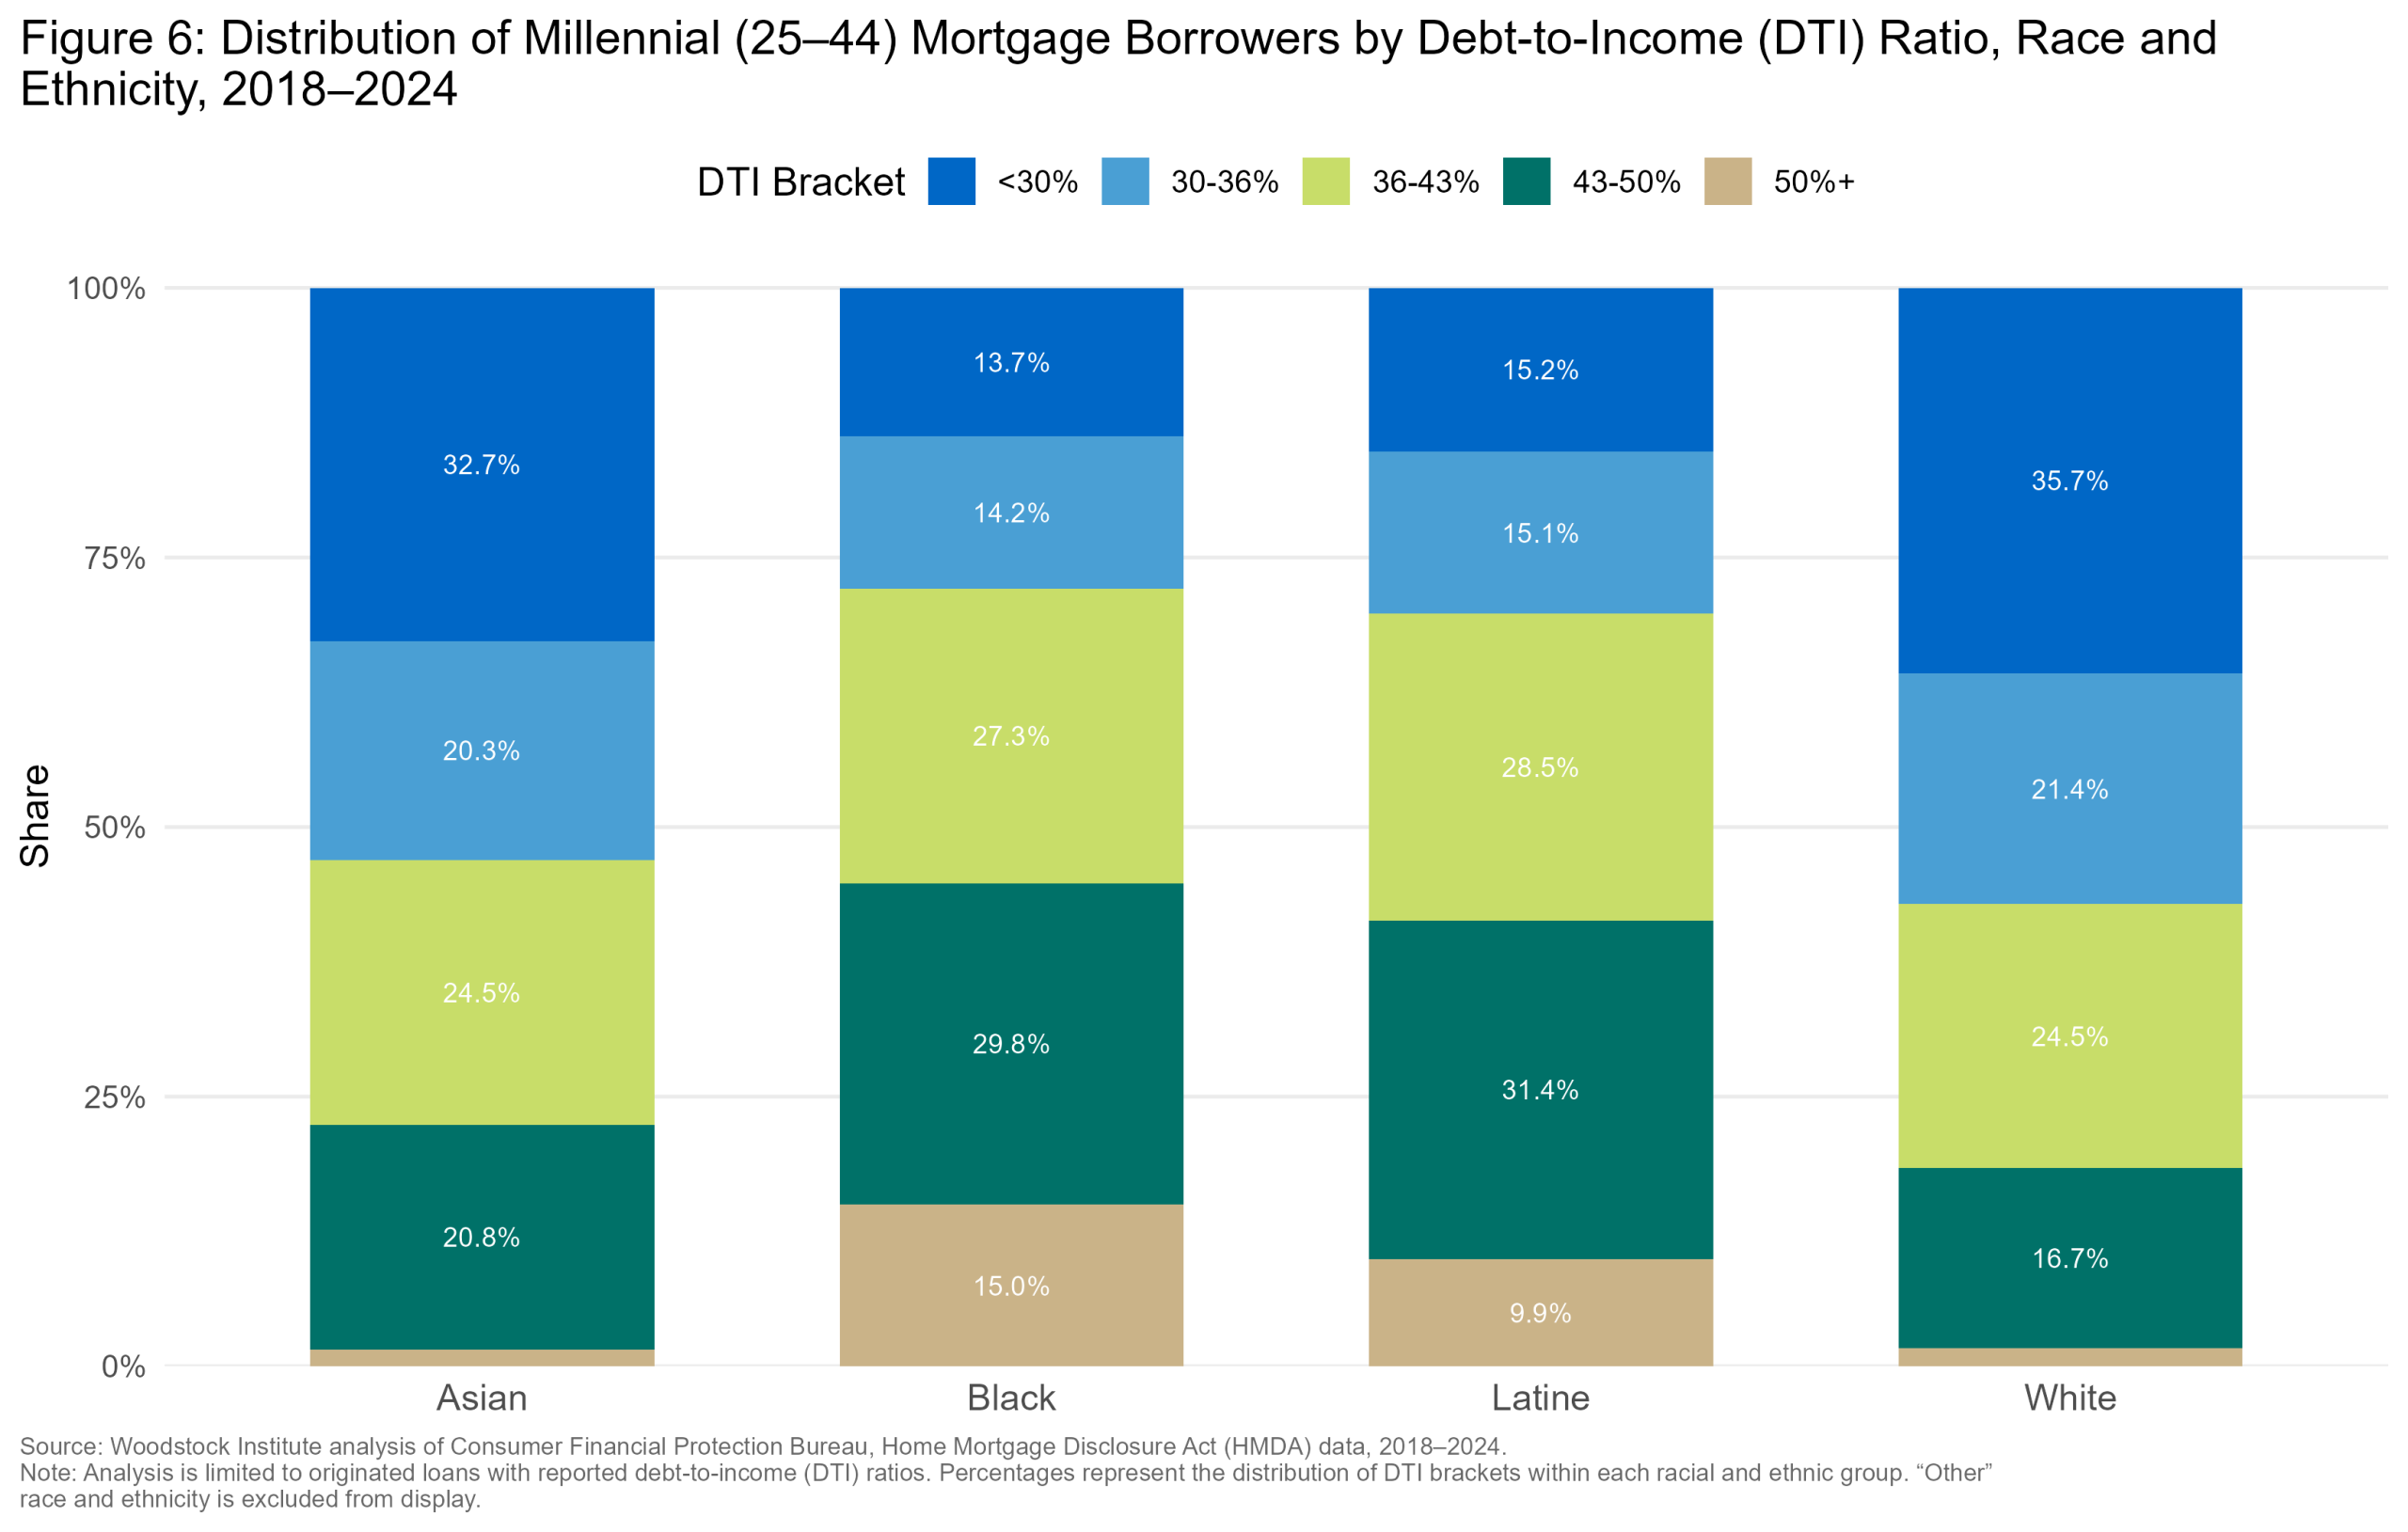
Black and Latine millennials are not only concentrated in lower income brackets; they are also disproportionately concentrated in the highest DTI and CLTV brackets. Statewide, only 25.6 percent of White millennial applicants had a DTI over 43 percent, compared with 47.6 percent and 43.9 percent of Black and Latine borrowers, respectively, and who would, therefore, be considered higher risk by financial institutions. Over 41 percent of Black and Latine millennial applicants in Chicago, the most diverse geography, had a DTI ratio over 43 percent, compared to under a quarter of White and Asian borrowers. For the “safer” DTI between 36 and 43 percent, across all geographies, all races represented approximately a quarter of mortgages, give or take a few percentage points. White and Asian millennial borrowers had the highest concentrations in the lower-risk 36 percent and lower DTI ratio brackets across all geographies. In Chicago, over half of White and Asian borrowers, had a DTI of less than 36 percent, compared to roughly 30 percent of Black and Latine borrowers. Millennial DTI patterns by race are similar to the broader applicant pool, however DTI alone does not capture the composition of potential borrower’s debt, which varies considerably across generations. (Figure 6)
plot_dti_bracket_race_Illinois.png / .jpg / .jpegCheck the file exists in the graphs folder and that this HTML is opened from a browser with local file access enabled.
plot_dti_bracket_race_Six_Collar.png / .jpg / .jpegCheck the file exists in the graphs folder and that this HTML is opened from a browser with local file access enabled.
plot_dti_bracket_race_Suburban_Cook.png / .jpg / .jpegCheck the file exists in the graphs folder and that this HTML is opened from a browser with local file access enabled.
plot_dti_bracket_race_Chicago.png / .jpg / .jpegCheck the file exists in the graphs folder and that this HTML is opened from a browser with local file access enabled.
New America’s research on the emerging millennial wealth gap found that millennials carry more non-asset-related debt relative to their income and assets compared to older generations2. Student loans, installment loans, and other forms of consumer debt make up a larger portion of debt for younger households. Data from the Federal Reserve’s 2022 Survey of Consumer Finances provides more national context into the sources of debt.
Millennials, like many other generations, heavily relied on student loans, but attended college during a time when the net price of tuition, fees, and room and board for one year at a public, four-year institution tripled from 1998-1999 to 2015-201619. By 2022, education installment loans were held by 40.1 percent of families headed by someone under age 35 and 34.1 percent of families ages 35 to 44, compared to 21.7 percent of families nationally20. Black millennials were substantially more likely to borrow for higher education and tended to borrow larger dollar amounts compared to their White and Latine peers, partially reflecting the lower levels of financial wealth available. Interestingly, Black people with a college degree have lower homeownership rates than White high school dropouts21. Latine millennials were more student loan averse, borrowing less frequently and in smaller amounts than their White peers2.
The burden extends beyond student loans. In 2022, installment loans were held by a substantial number of those under 44 years old. Approximately 71.4 percent of families under 35 and 64.9 percent of families ages 35 to 44 held installment loans, the highest shares across all age groups. At the same time, younger families were considerably less likely to hold a primary residence, with only 38.5 percent of families headed by someone under the age of 35 and 61.1 percent of families aged 35 to 44, compared to more than 70 percent of older generations20. These patterns suggest that many younger households enter their prime homebuying years carrying significant non-mortgage debt that can consume a large portion of household income for years, impacting borrowers’ savings, wealth accumulation, and purchasing power22.
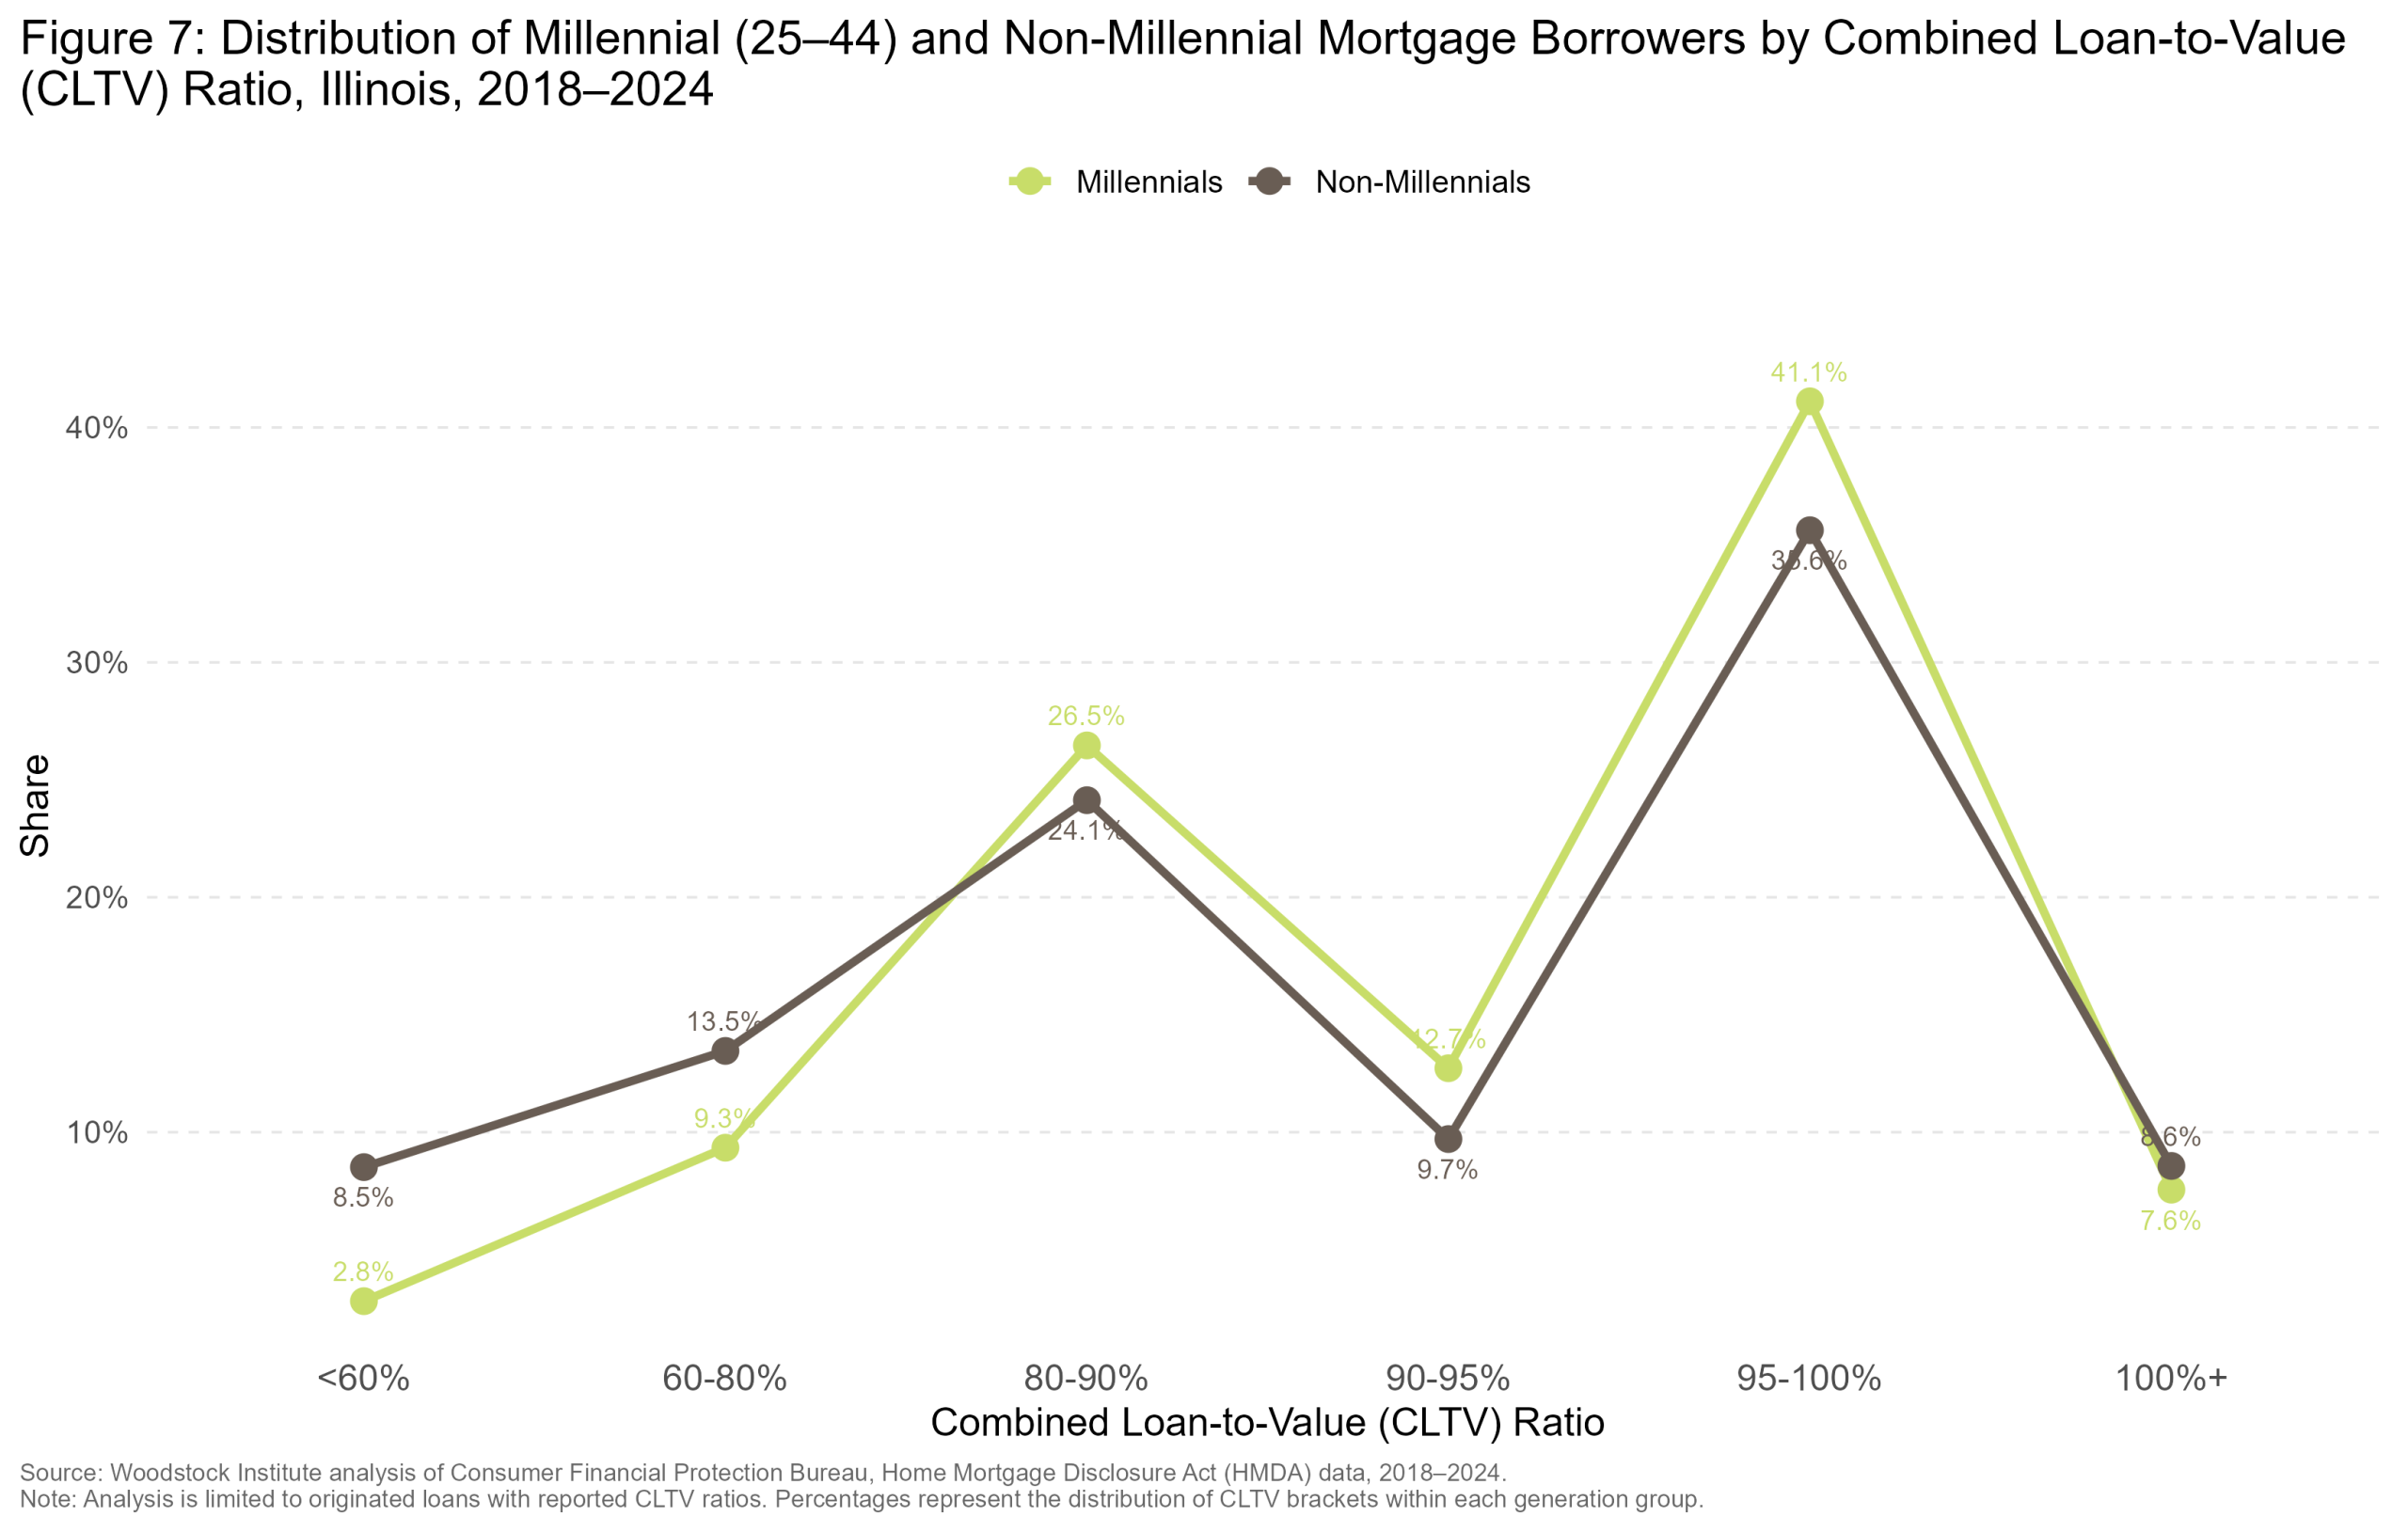
While DTI reflects the share of a borrower’s income committed to debt, CLTV provides a complementary measure of how much equity the borrower has in a property at purchase. Across Illinois, millennial borrowers were more concentrated in higher CLTV brackets than non-millennial borrowers. Millennials were more likely to have CLTV ratios between 95 and 100 percent, and substantially less likely to fall below 80 percent, a pattern consistent with smaller down payments and less initial equity. (Figure 7)
cltv_distribution_millennials_vs_non_millennials_Illinois.png / .jpg / .jpegCheck the file exists in the graphs folder and that this HTML is opened from a browser with local file access enabled.
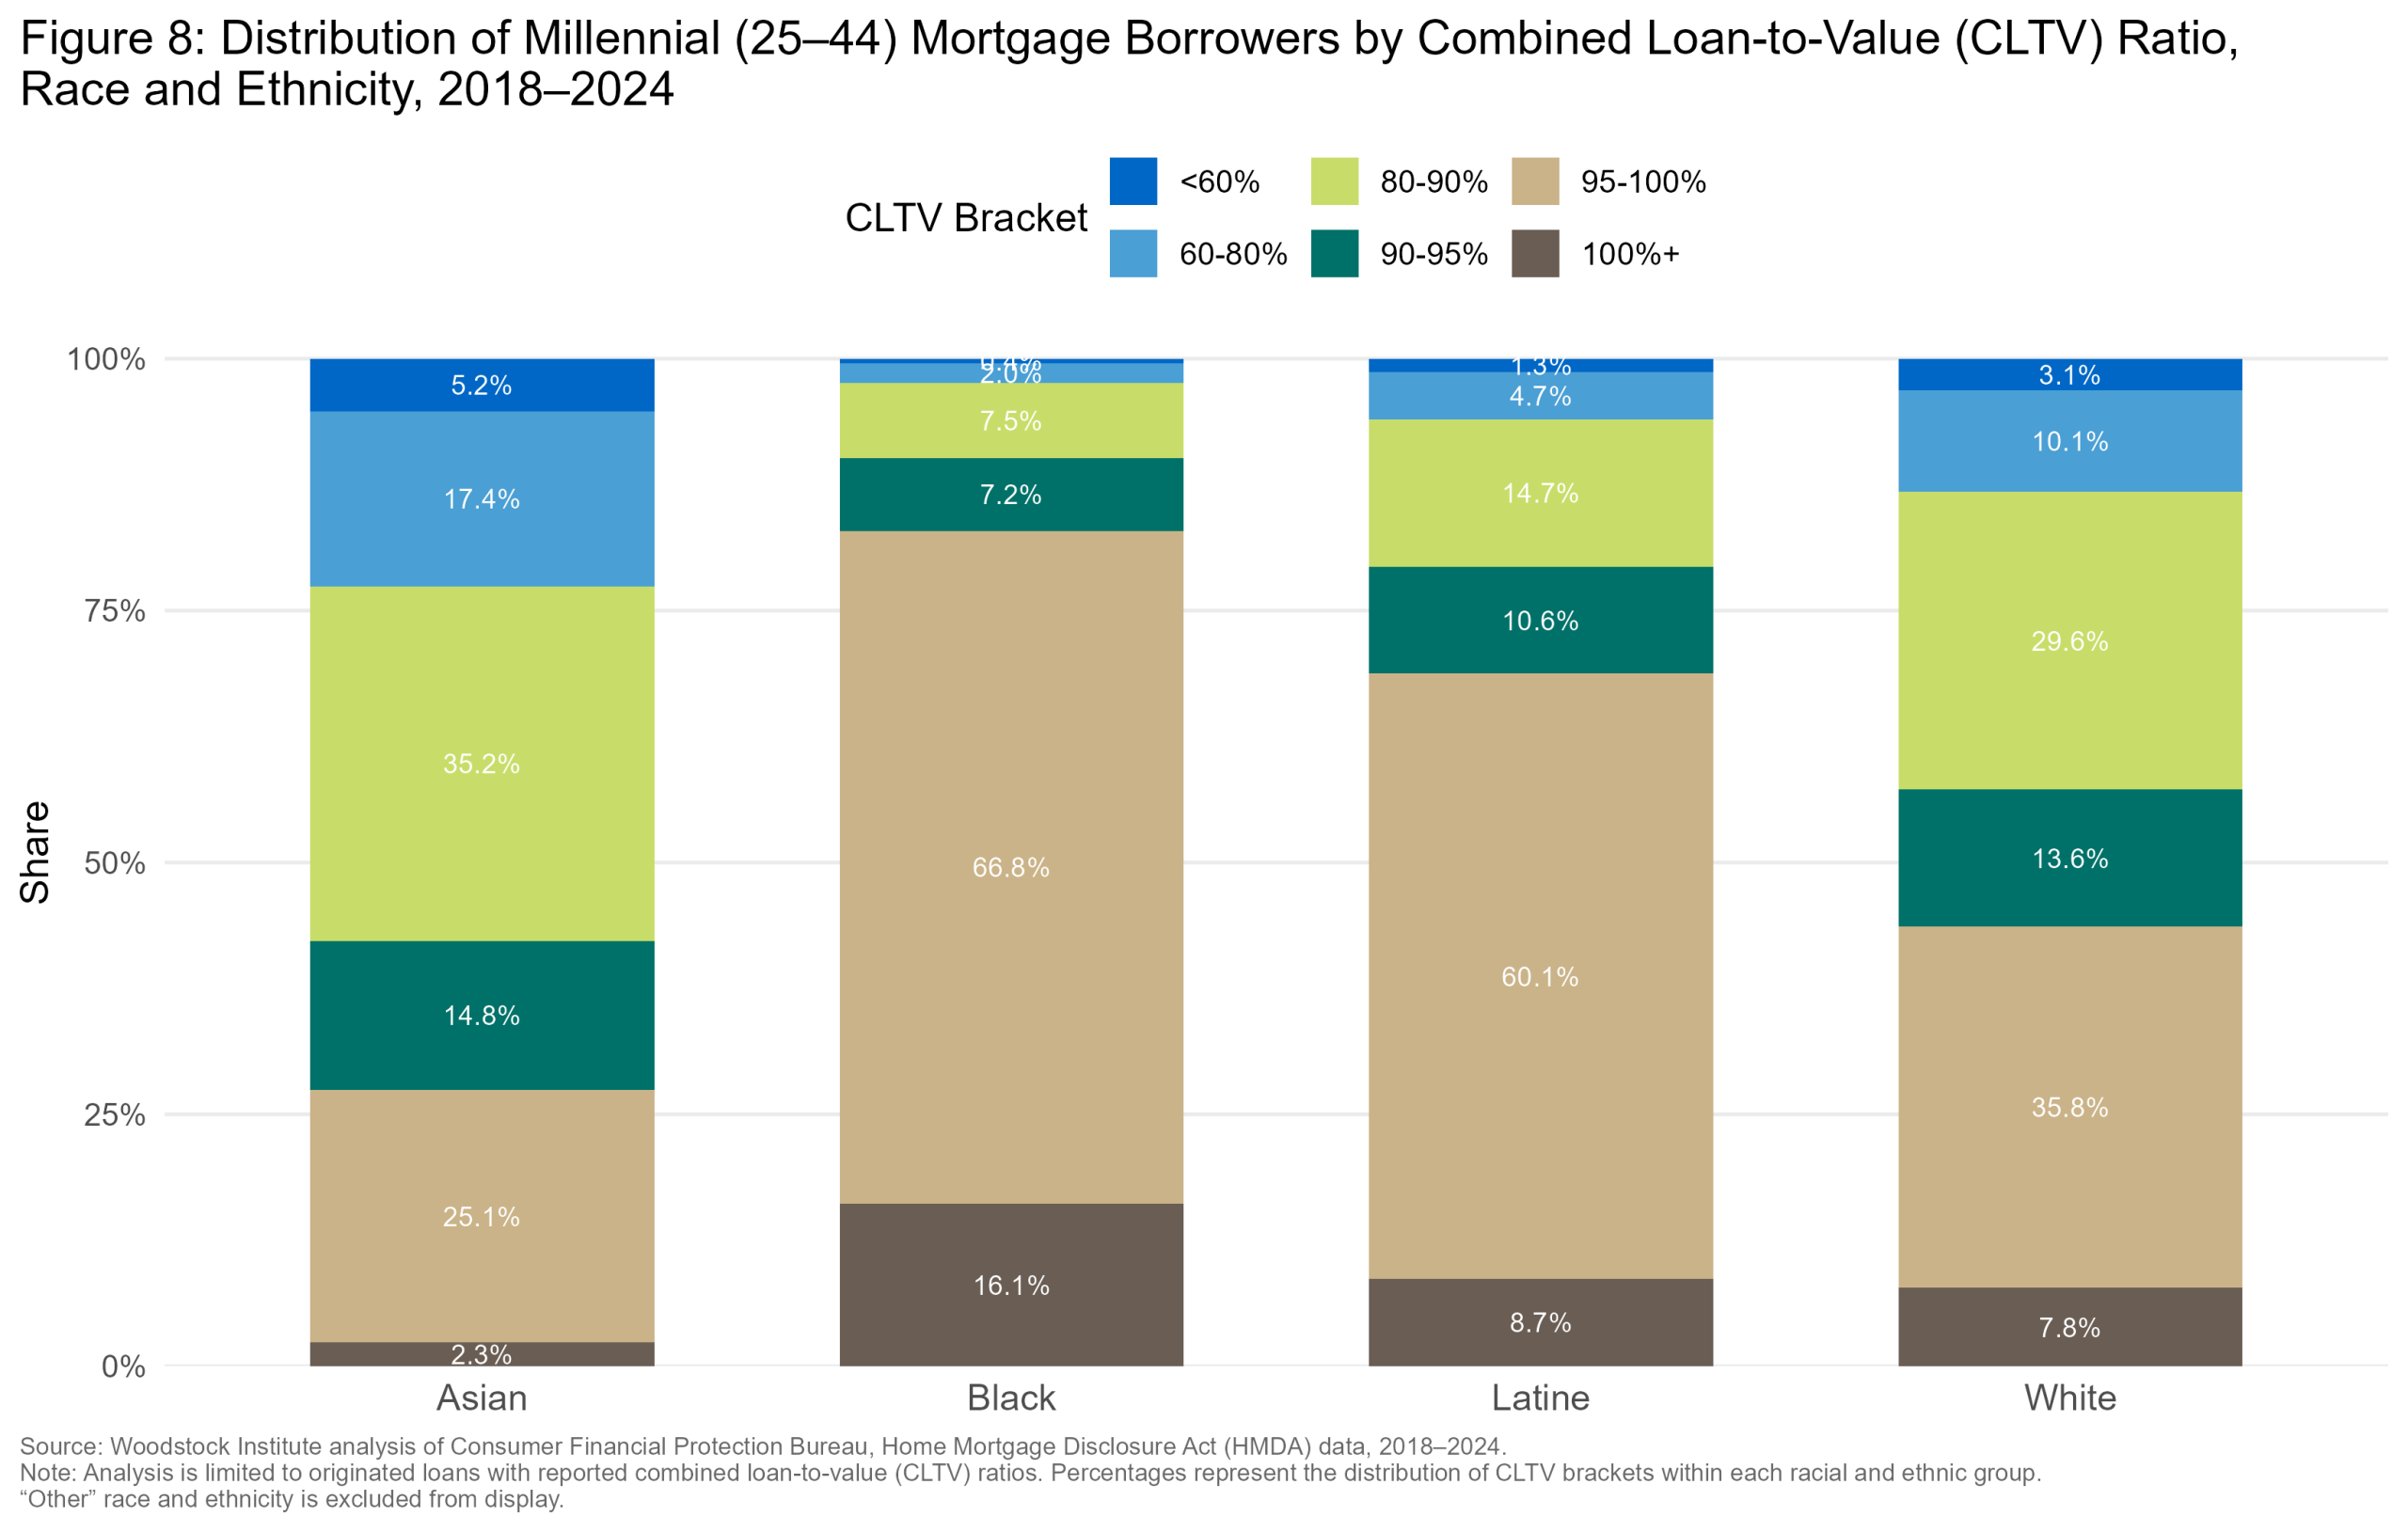
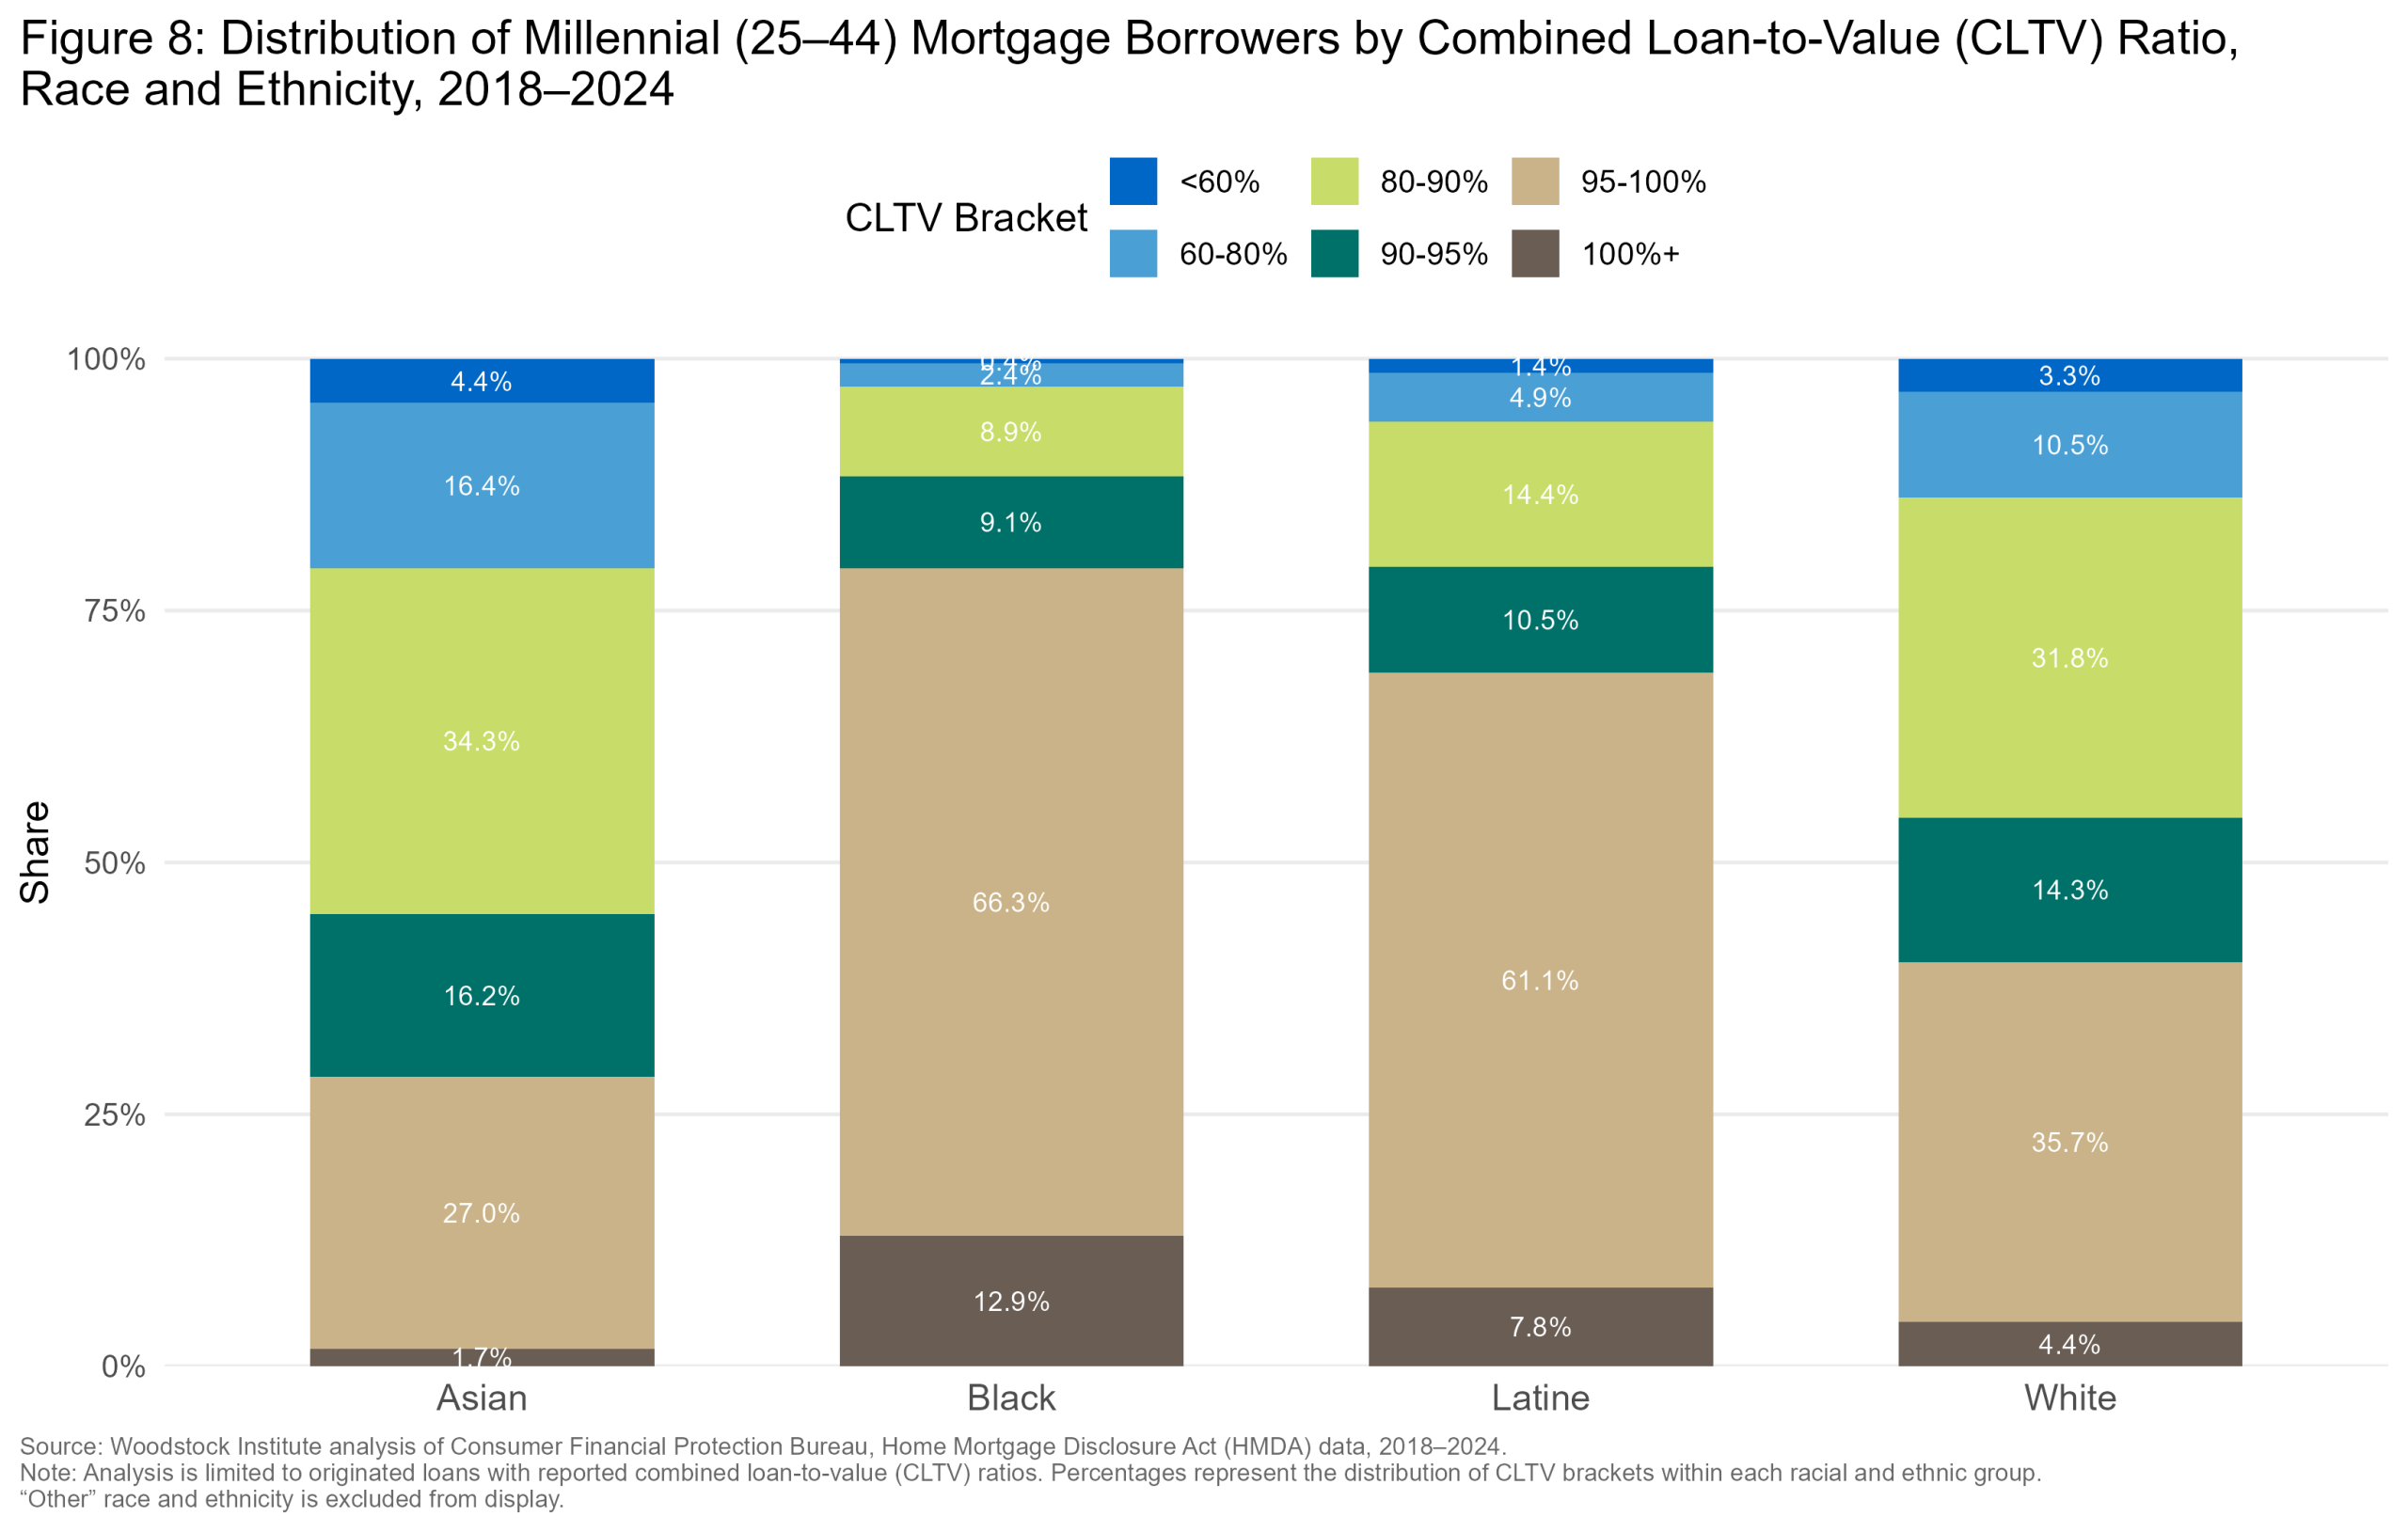
Within that shared reality, Black and Latine borrowers carry disproportionately more of both the debt burden and high leverage, layering additional risk on top of the income gap described previously. CLTV can indicate the initial down payment and equity of the property purchased, a lower CLTV indicating a higher down payment and initial equity. Statewide, White and Asian borrowers have the highest share of loans in the lower leverage brackets (under 80 percent CLTV) and the lowest share in the highest risk bracket (100 percent and over). Black and Latine borrowers showed the opposite pattern. Approximately 82.9 percent of Black borrowers and 68.8 percent of Latine borrowers have a CLTV over 95 percent, compared to 43.6 percent of White borrowers and 27.4 percent of Asian borrowers. (Figure 8)
This pattern is consistent across all geographies, with Black and Latine borrowers having the highest share of borrowers in higher risk/lower equity brackets. Loans with higher CLTV are particularly vulnerable to market downturns, leaving borrowers underwater. Properties with negative equity combined with falling home prices, subprime lending, and predatory lending standards accelerated the 2008 subprime mortgage and foreclosure crisis23. Combined with the high debt burden, being overleveraged means Black and Latine millennials have the least room to absorb an unexpected home repair, market downturn, income shock, tax hike, and more, making them financially fragile homeowners. Taken together, these measures describe substantially different starting positions among millennial applicants that impact the likelihood of receiving the loan, the types of credit available, and the prices paid to close the loan.
cltv_bracket_distribution_by_race_Illinois.png / .jpg / .jpegCheck the file exists in the graphs folder and that this HTML is opened from a browser with local file access enabled.
cltv_bracket_distribution_by_race_Six_Collar_County.png / .jpg / .jpegCheck the file exists in the graphs folder and that this HTML is opened from a browser with local file access enabled.
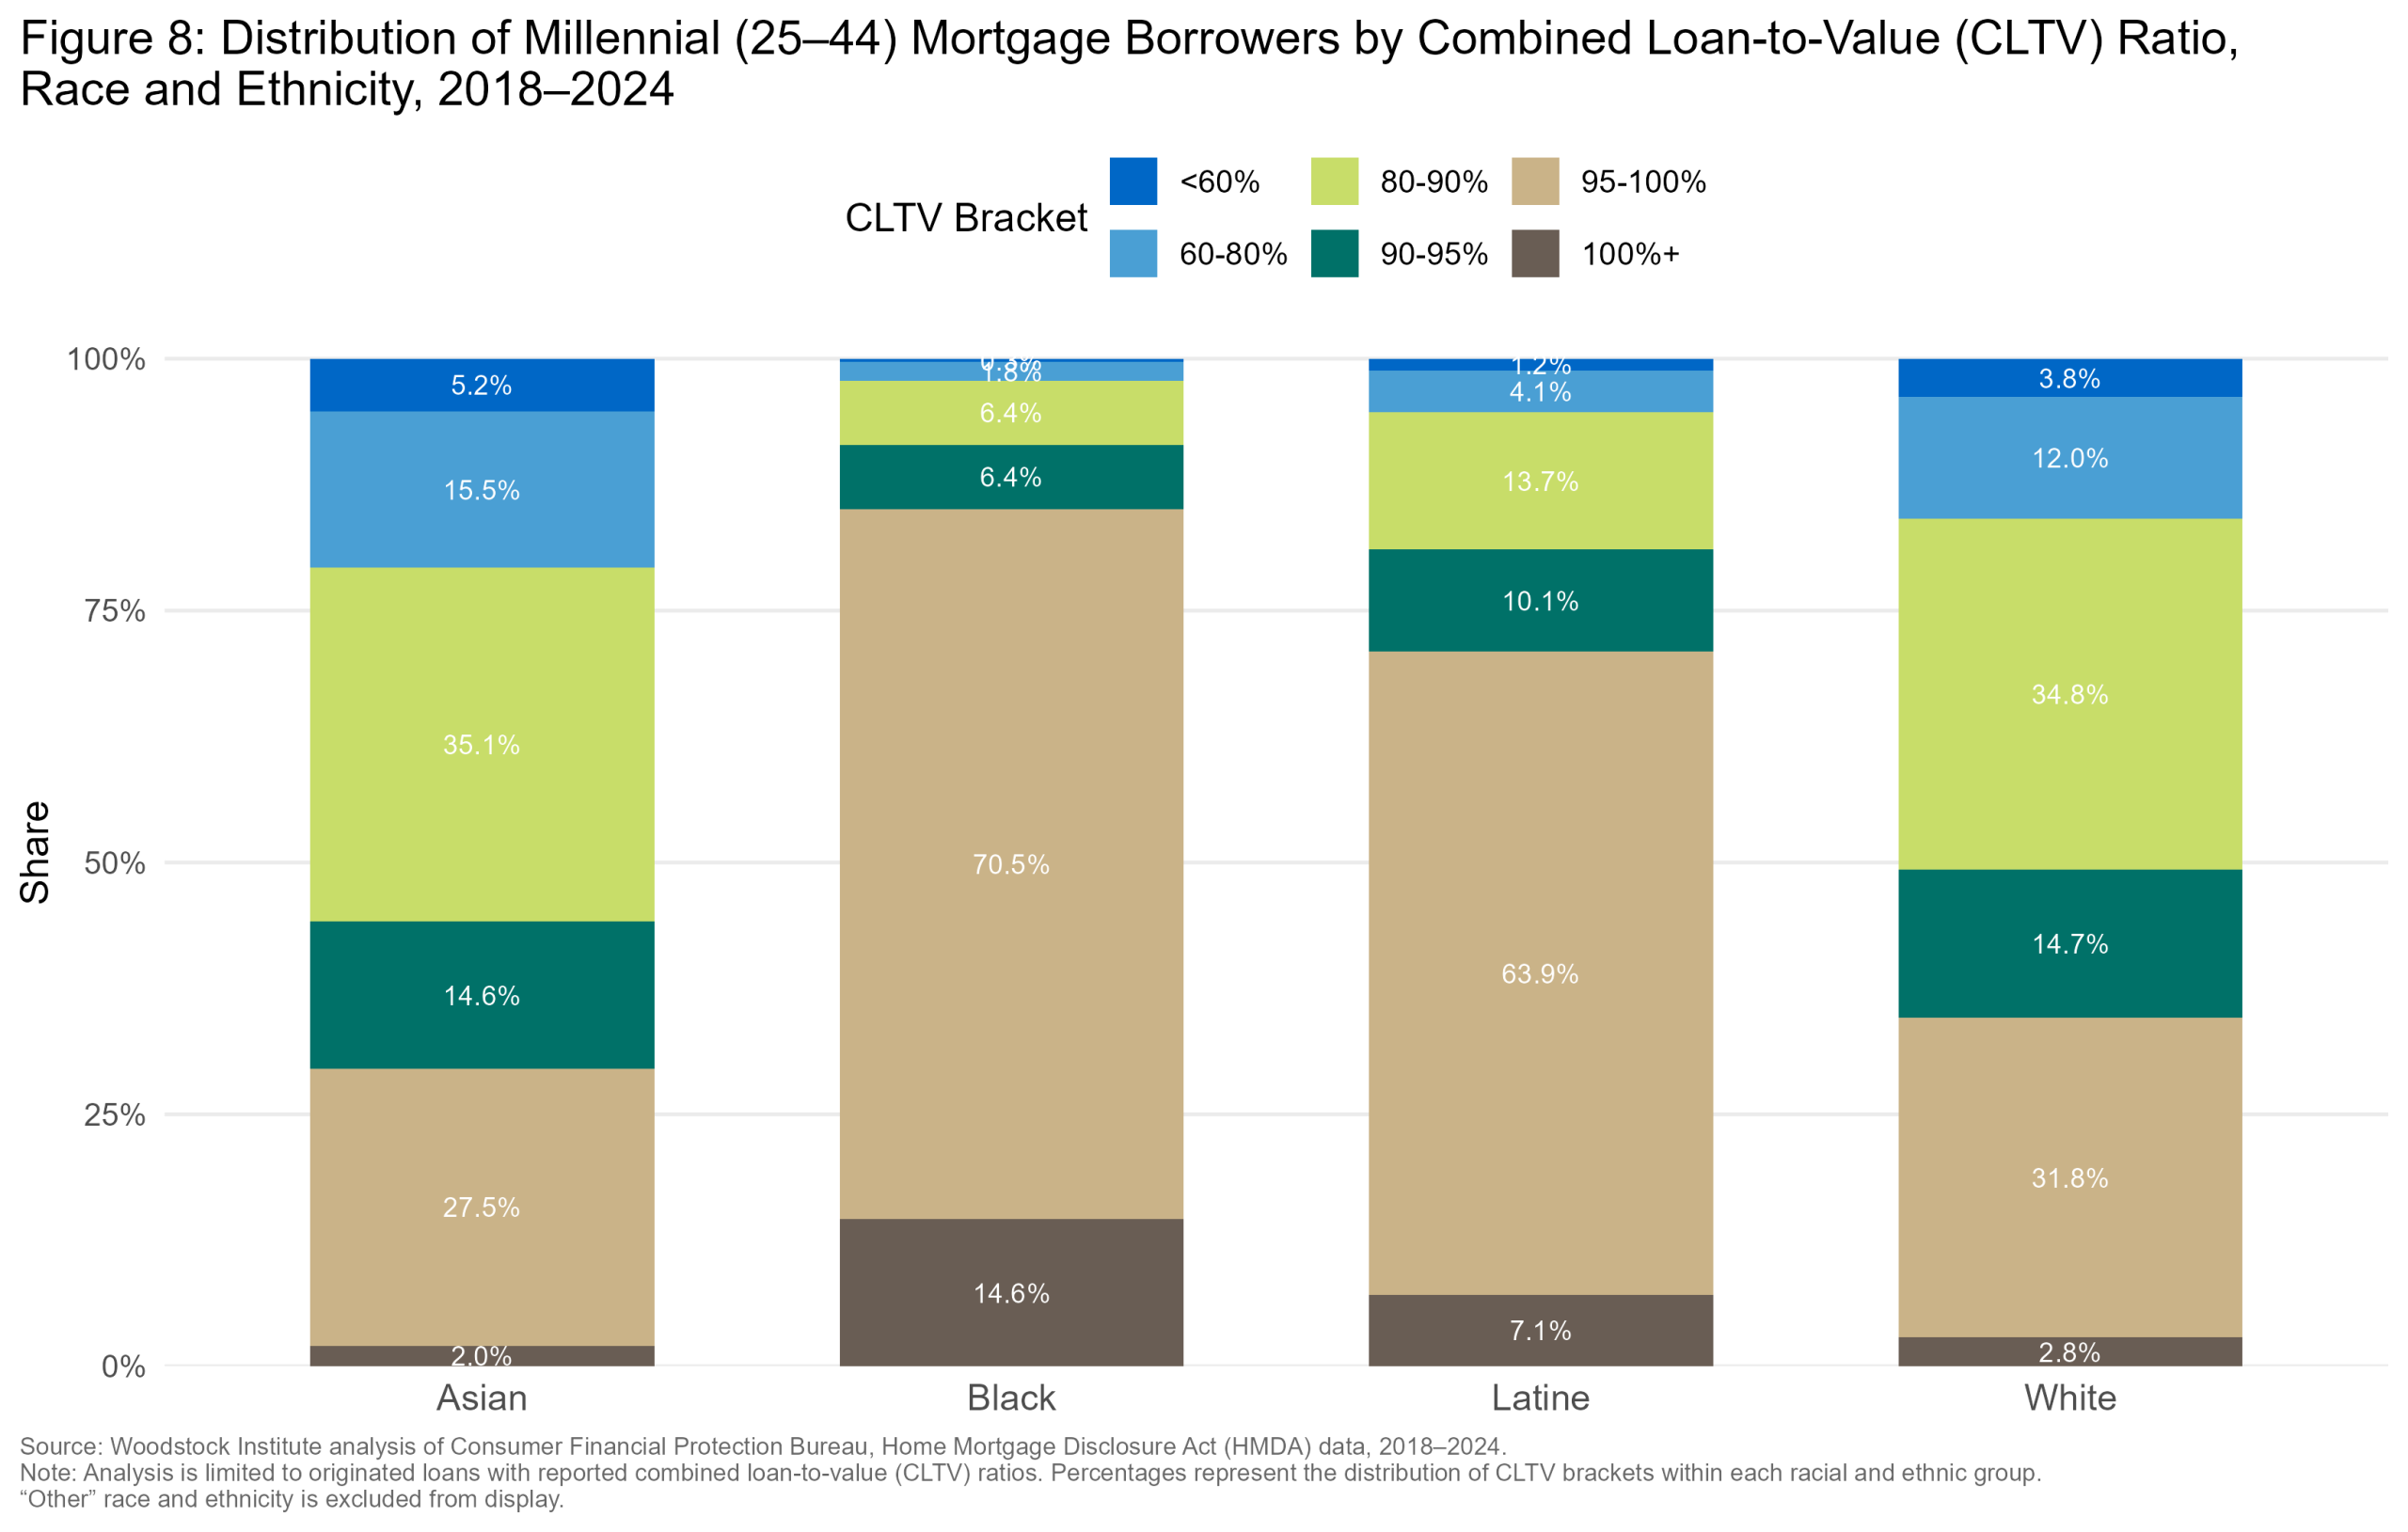
cltv_bracket_distribution_by_race_Suburban_Cook.png / .jpg / .jpegCheck the file exists in the graphs folder and that this HTML is opened from a browser with local file access enabled.
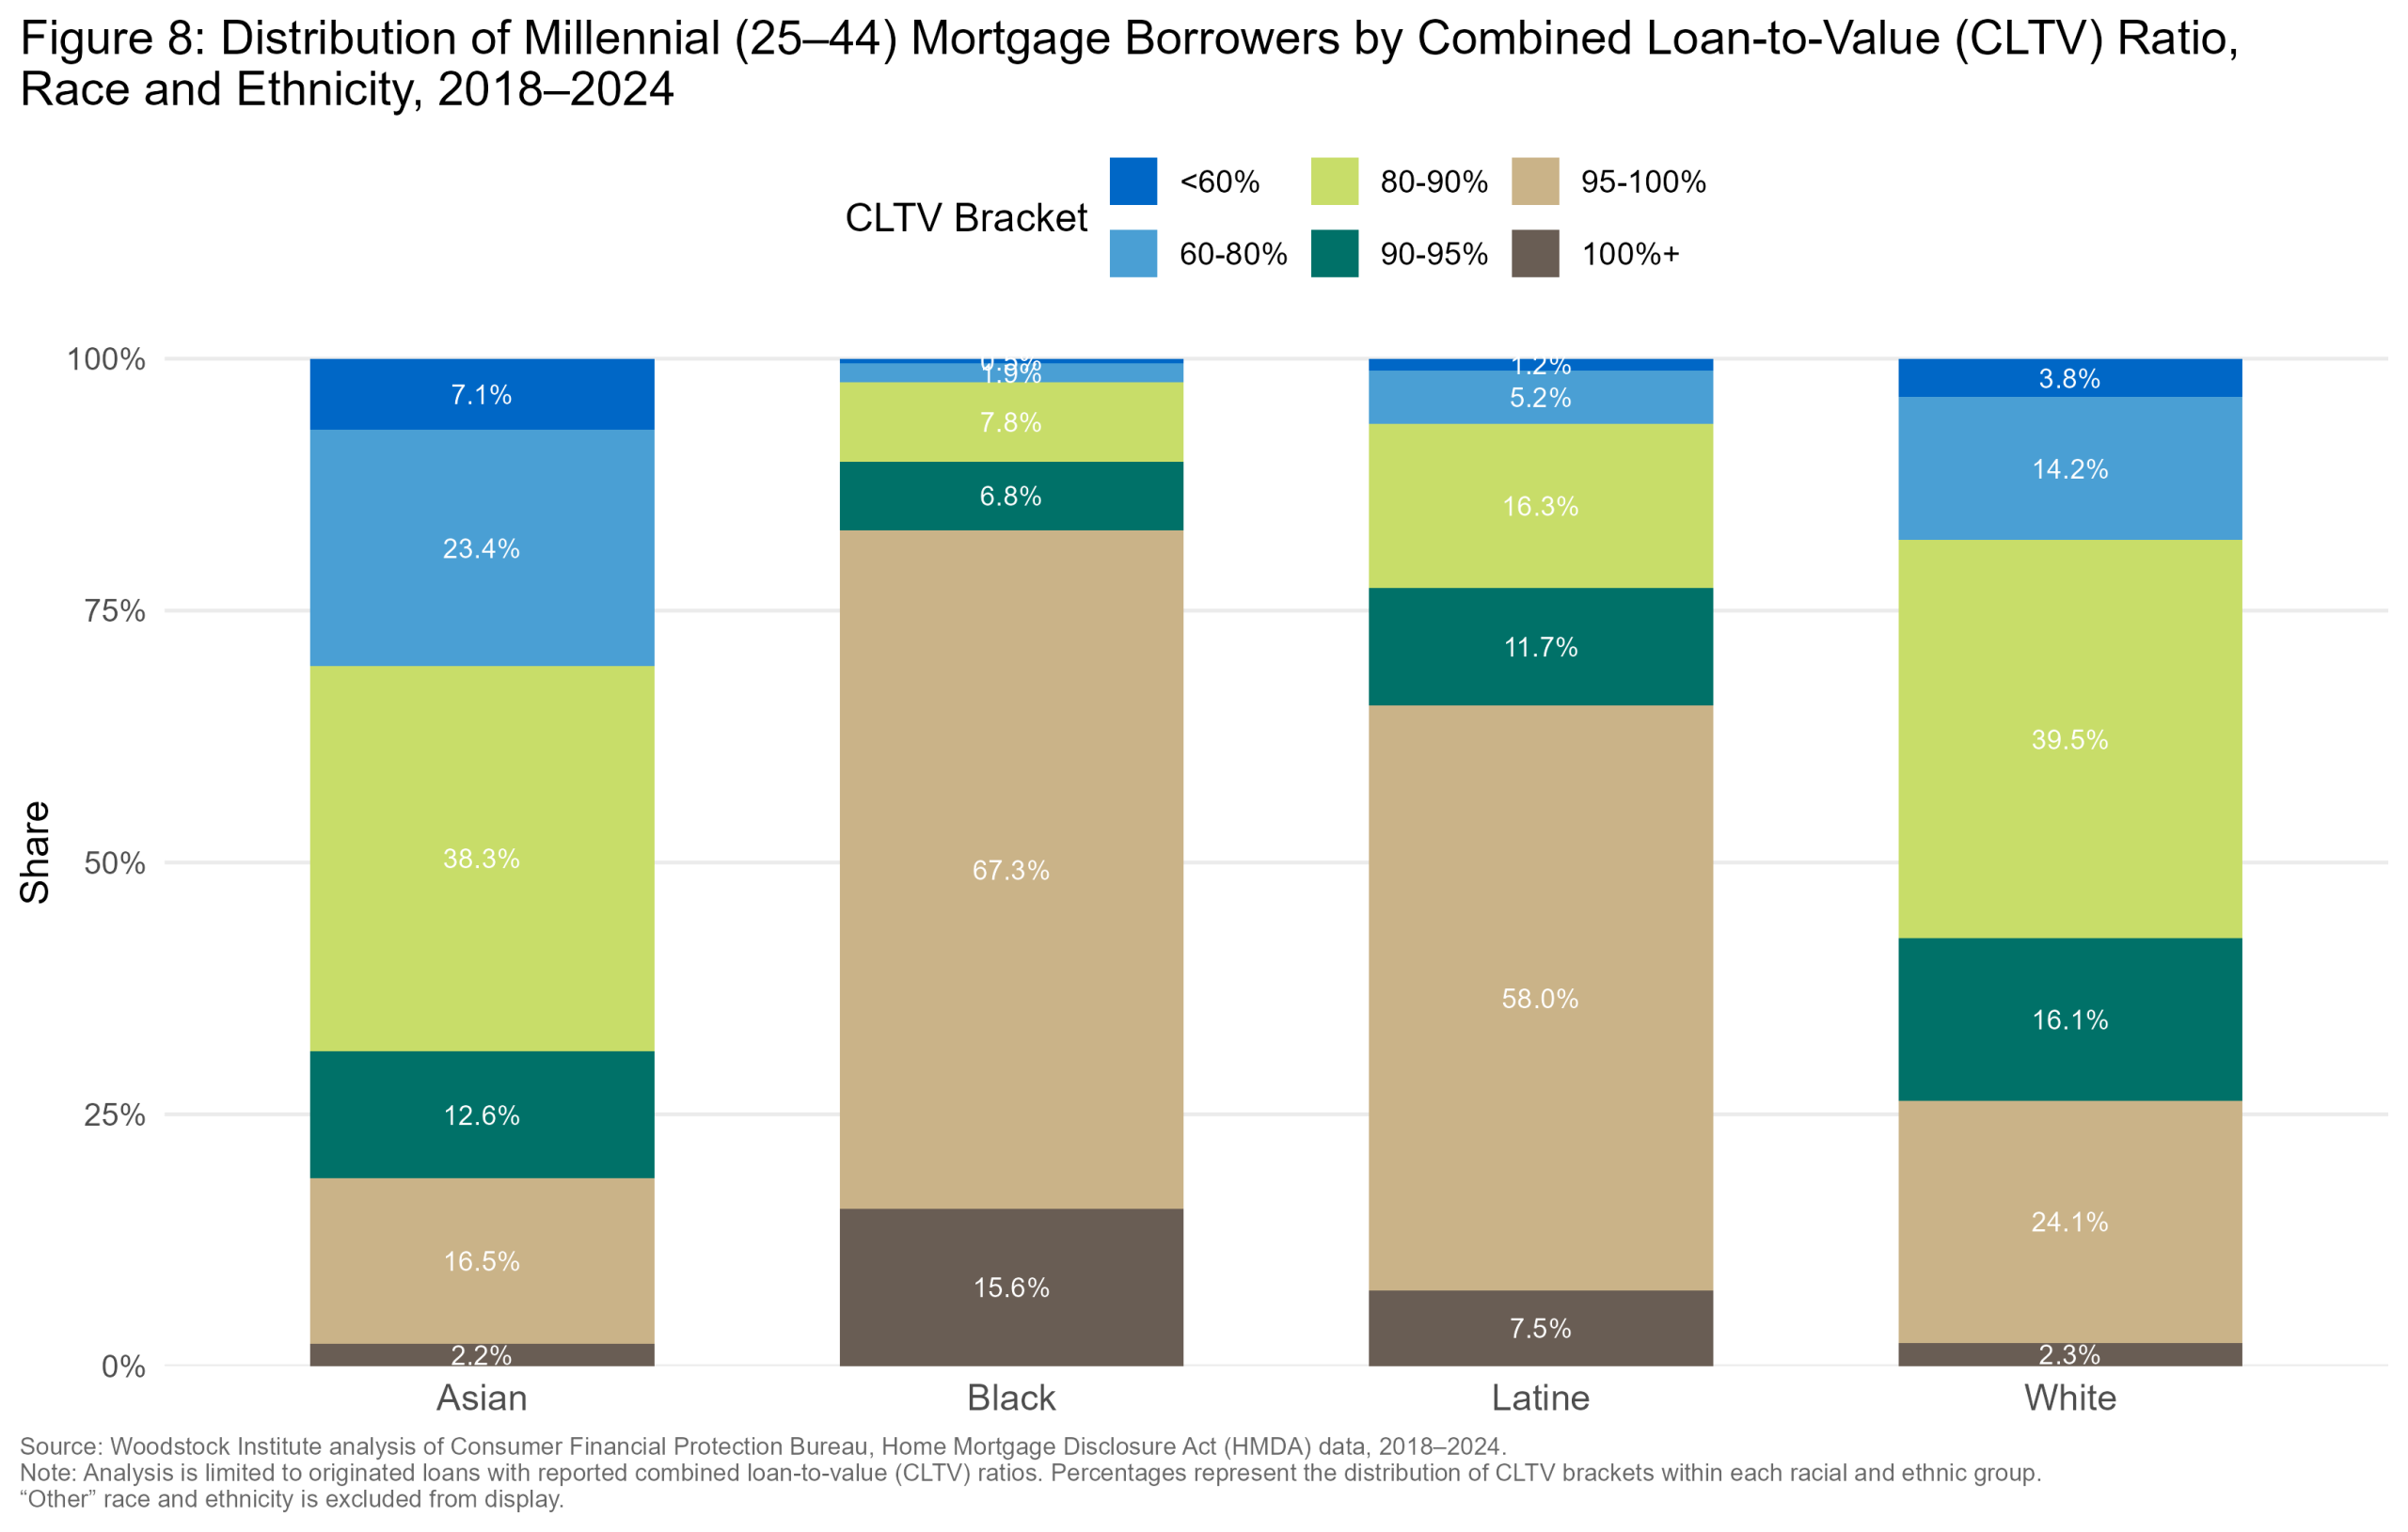
cltv_bracket_distribution_by_race_Chicago.png / .jpg / .jpegCheck the file exists in the graphs folder and that this HTML is opened from a browser with local file access enabled.
Property values
To put CLTV into further context, the median property values for Black and Latine borrowers are substantially lower than White and Asian borrowers across all geographies. Statewide, the median property value was $225,000 for Black borrowers and $245,000 for Latine borrowers, compared to $275,000 for White borrowers, and $375,000 for Asian borrowers. Similar disparities appear in the six collar counties, suburban Cook County, and Chicago. In Chicago, one of the most pronounced gaps of all geographies, median property values were $255,000 for Black borrowers, and $275,000 for Latine borrowers, approximately $170,000 and $150,000 lower than White and Asian borrowers, respectively. (Table 1)
These differences in property values provide important context for CLTV findings, as Black and Latine borrowers are more concentrated in highest CLTV brackets for lower value properties. For example, a borrower with a 95 percent CLTV on a $225,000 property has approximately $11,250 in initial equity, compared to $18,750 on a $375,000 property at the same CLTV. As a result, Black and Latine millennial borrowers may enter homeownership with less equity in both percentage and dollar terms. The combination of lower property values, higher debt constraints, and greater leverage can leave borrowers with a smaller equity cushion and less capacity to absorb unexpected expenses.
| Race/Ethnicity | Illinois | Six Collar Counties | Suburban Cook County | Chicago |
|---|---|---|---|---|
| Asian | $375k | $405k | $355k | $425k |
| Black | $225k | $265k | $205k | $255k |
| Latine | $245k | $245k | $245k | $275k |
| White | $275k | $325k | $335k | $425k |
| Source: Woodstock Institute analysis of Consumer Financial Protection Bureau, Home Mortgage Disclosure Act (HMDA) data, 2018–2024. Note: Analysis is limited to originated loans with reported property values. “k” indicates that median property values are reported in thousands of dollars. “Other” race and ethnicity is excluded. | ||||
Map of mortgage origination distribution
Across Illinois, more than 70 percent of millennial originations occurred in Chicago, suburban Cook County, and the six collar counties, reflecting the broader market. However, the distribution of originations within and beyond this region varied considerably by race and ethnicity.
Asian originations were heavily concentrated in the seven-county region including Cook County and were scattered sparingly across approximately ten other counties. In Chicago and suburban Cook County, Asian millennial borrowers were heavily concentrated on the northern parts of the geographies, with a notable concentration of Asian millennial borrowers in DuPage County. (Map 1)
Black millennial originations were more geographically concentrated in the southern part of suburban Cook County and south and west sides of Chicago, reflecting longstanding racial residential patterns in the regions. Black households continued to purchase homes in predominantly Black neighborhoods, where property values tend to appreciate slower and at lower rates than other neighborhoods24. There was some lending activity for Black borrowers in the six-collar counties, but it was not as pronounced or concentrated as other groups. (Map 2)
Latine millennial borrowers were somewhat dispersed across the state but again, concentrated in Chicago, suburban Cook County, and the collar counties. Many Latine borrowers had loans originated across suburban Cook County, Chicago (except for a few southside areas), across DuPage County, and many parts of the other six collar counties. (Map 3)
White millennial borrowers exhibited the broadest geographic distribution across Illinois, with substantially more lending activity outside of the seven county region than any other race. Similar to Asian borrowers, many of the White millennial borrowers were concentrated on the northside of Chicago and suburban Cook County. (Map 4)
These maps show that the geographic footprint of millennial mortgage lending differs by race and ethnicity. Black millennial originations continue to be distributed in historic geographic patterns of residential segregation, and White millennial originations exhibited the broadest statewide distribution.
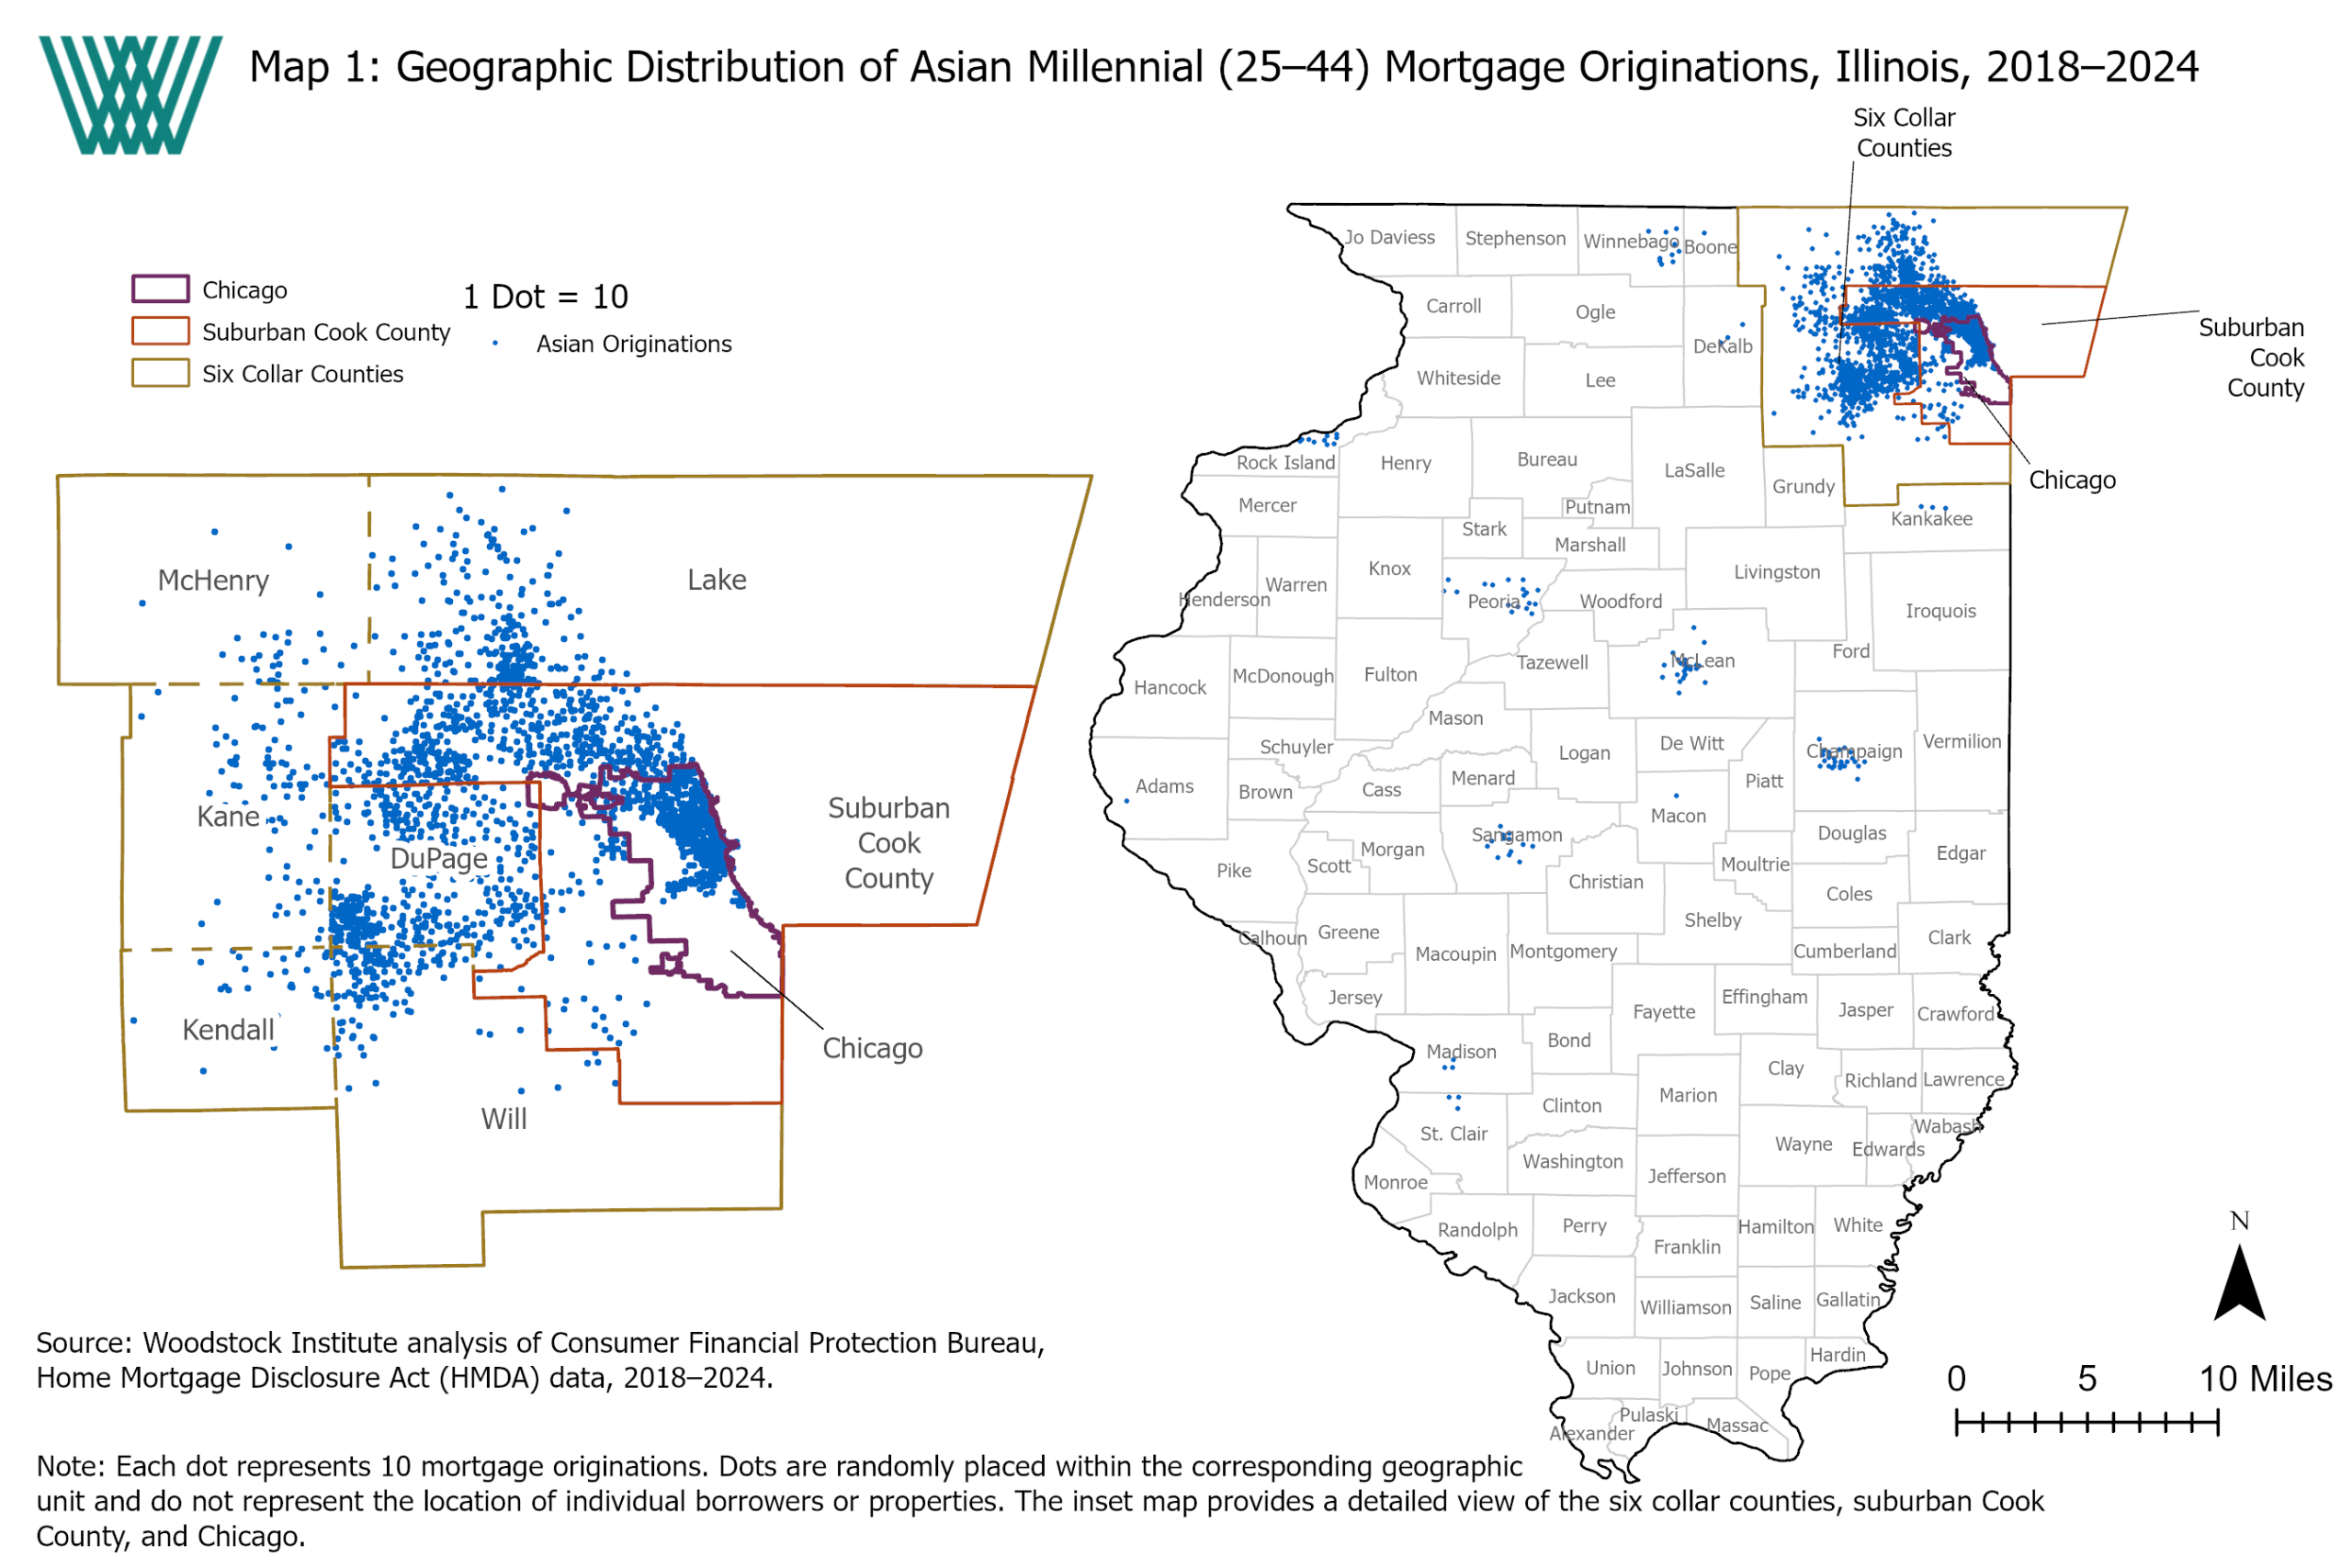
Asian-Originations-Final.png / .jpg / .jpegCheck the file exists in the graphs folder and that this HTML is opened from a browser with local file access enabled.
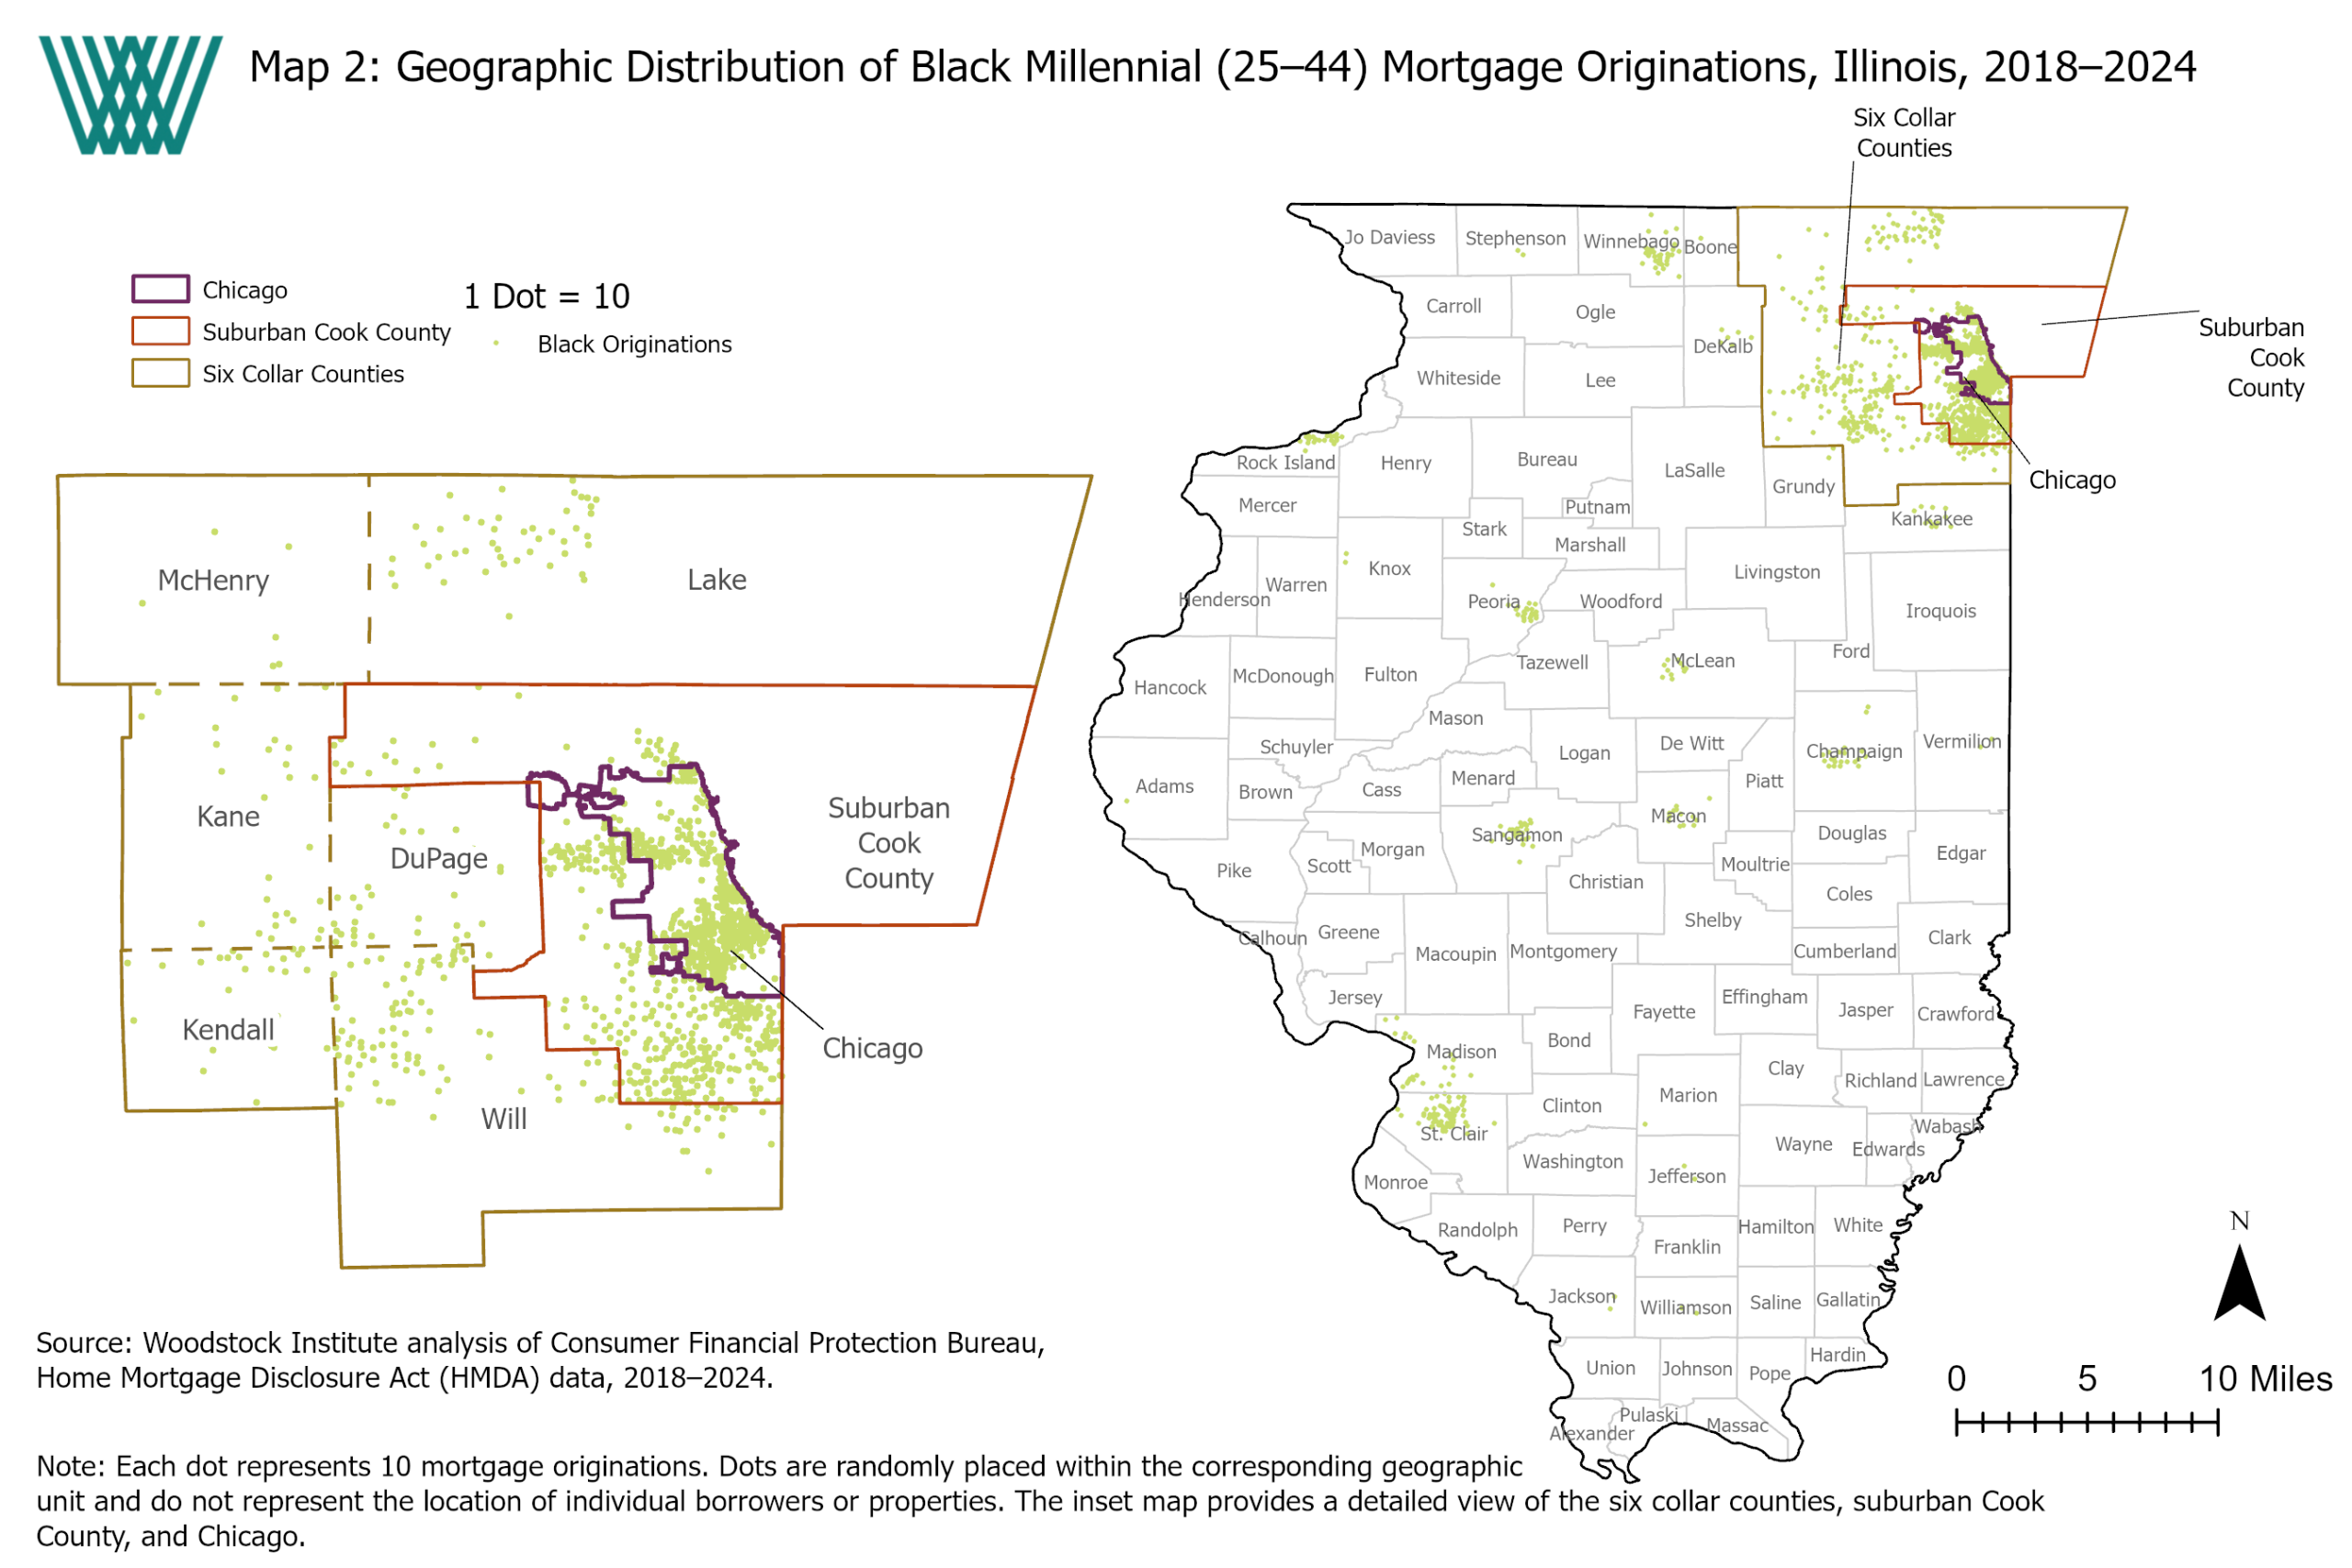
Black-Originations-Final.png / .jpg / .jpegCheck the file exists in the graphs folder and that this HTML is opened from a browser with local file access enabled.
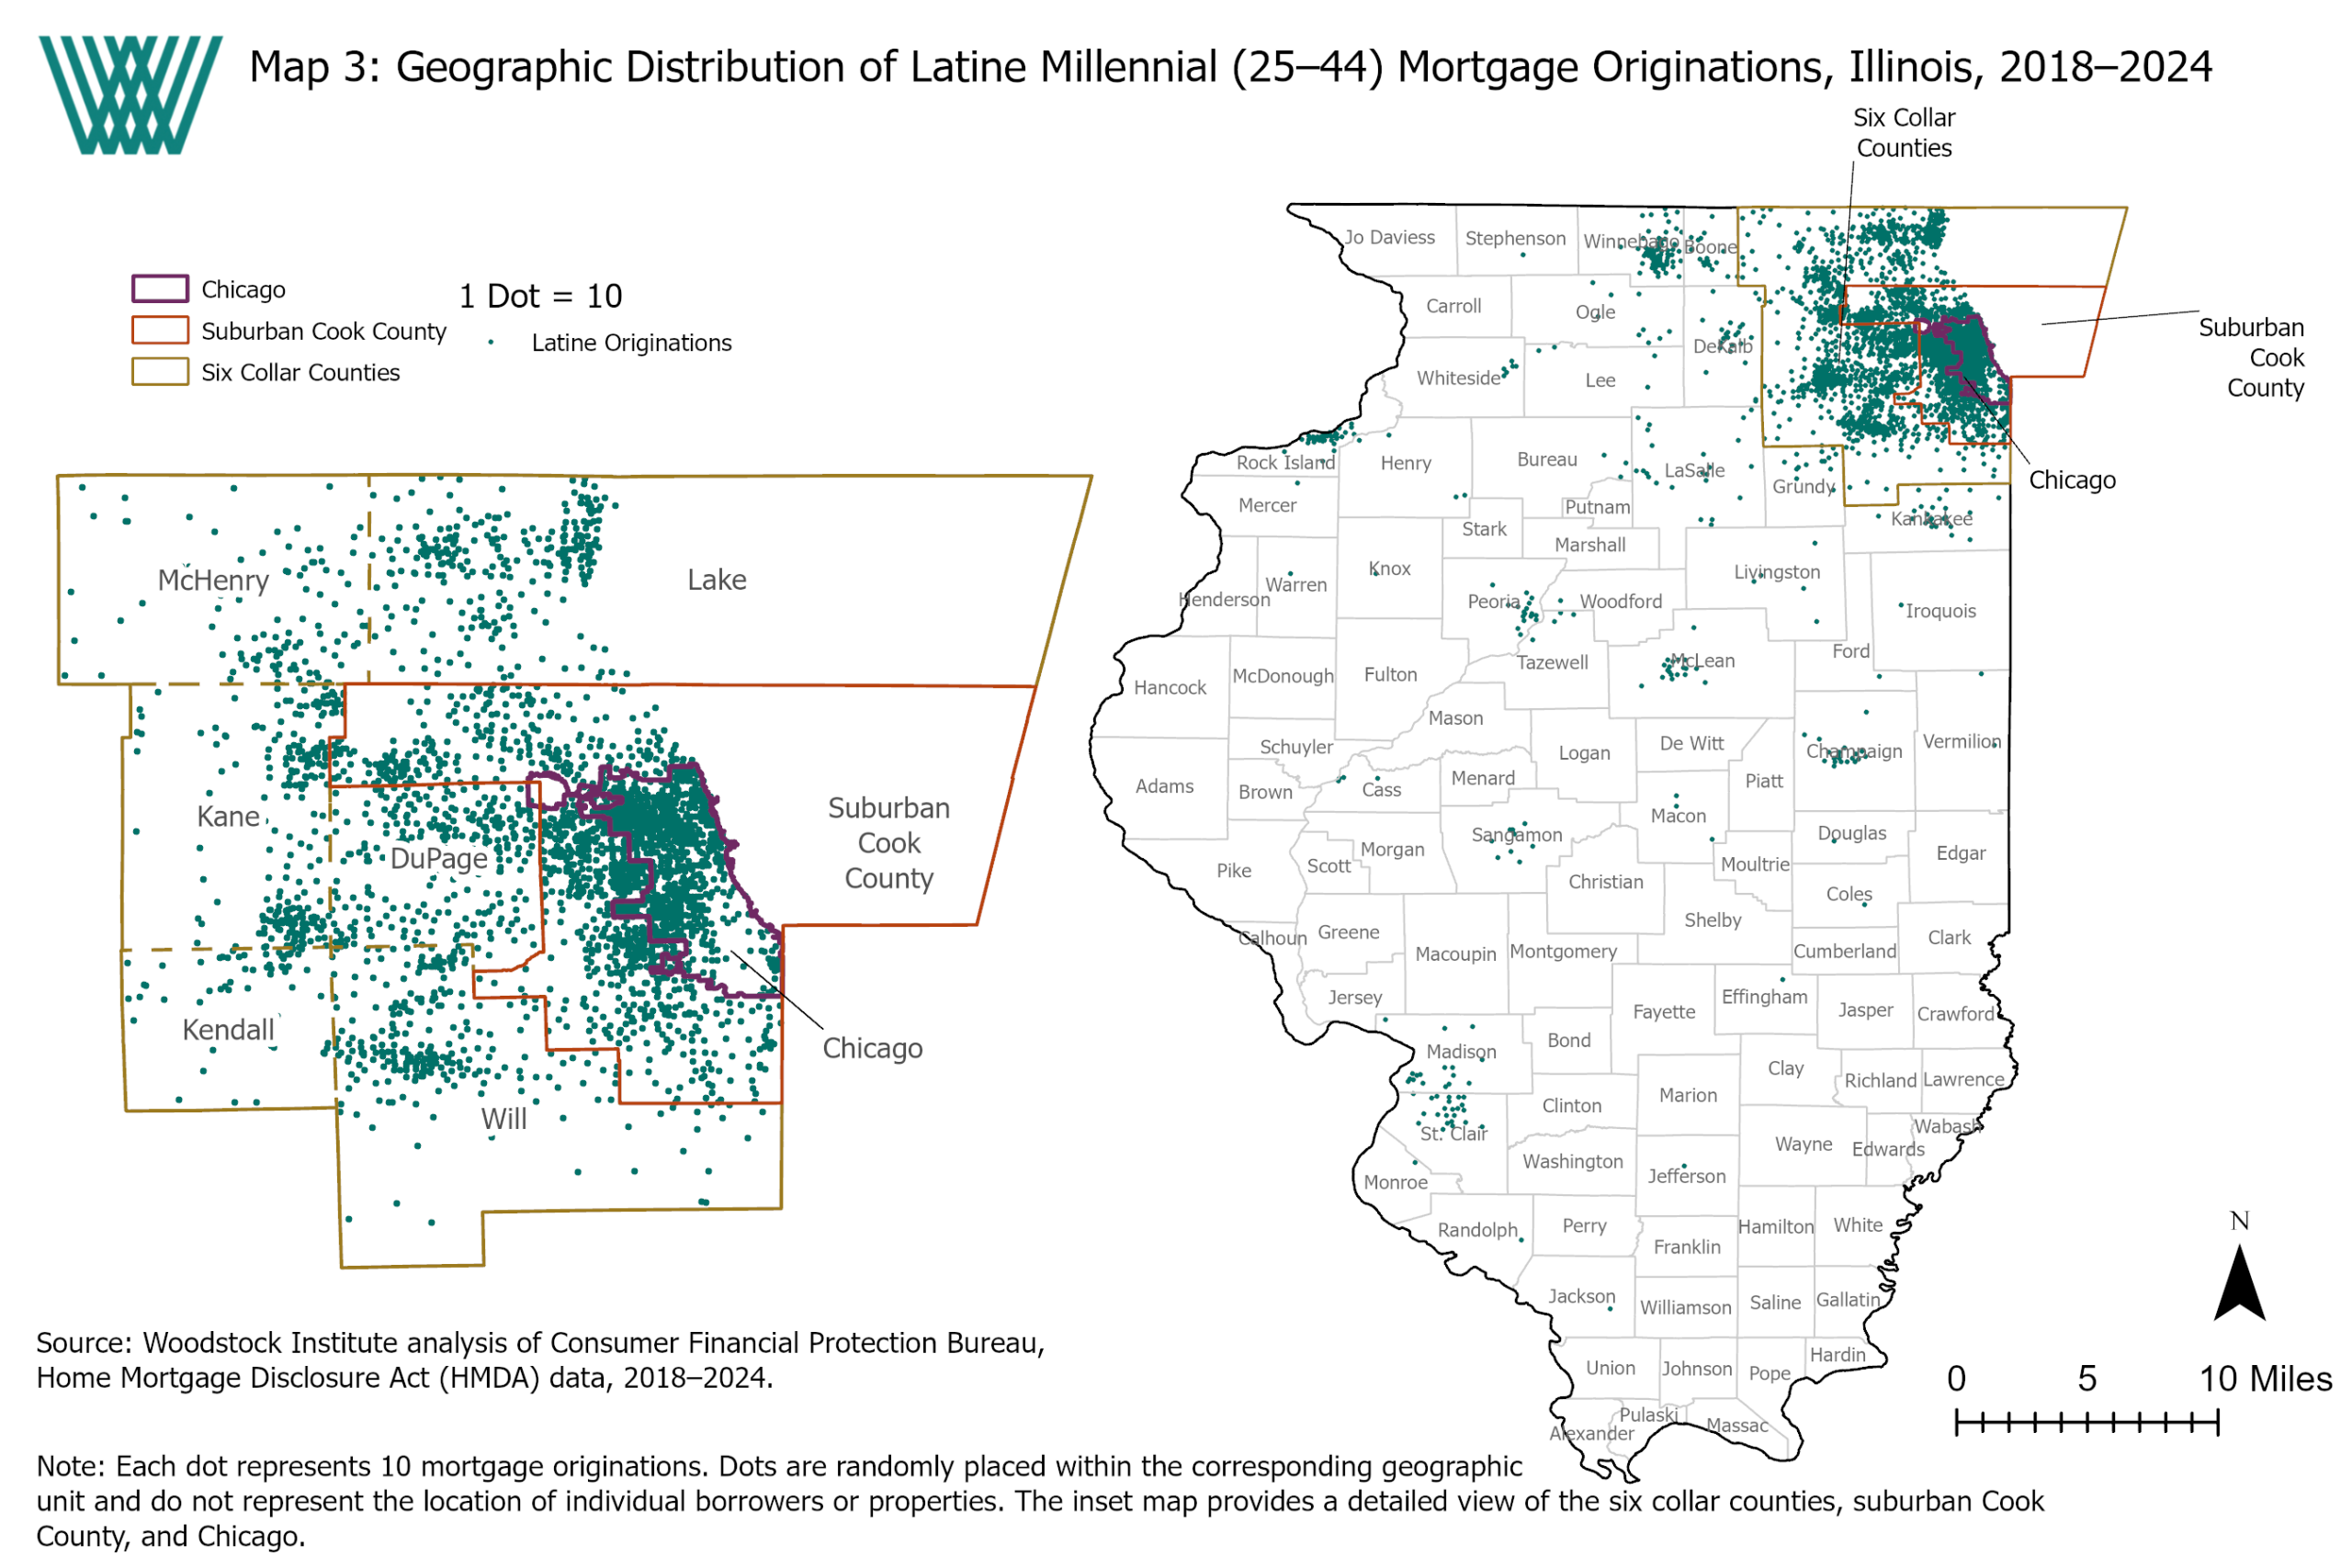
Latine-Originations-Final.png / .jpg / .jpegCheck the file exists in the graphs folder and that this HTML is opened from a browser with local file access enabled.
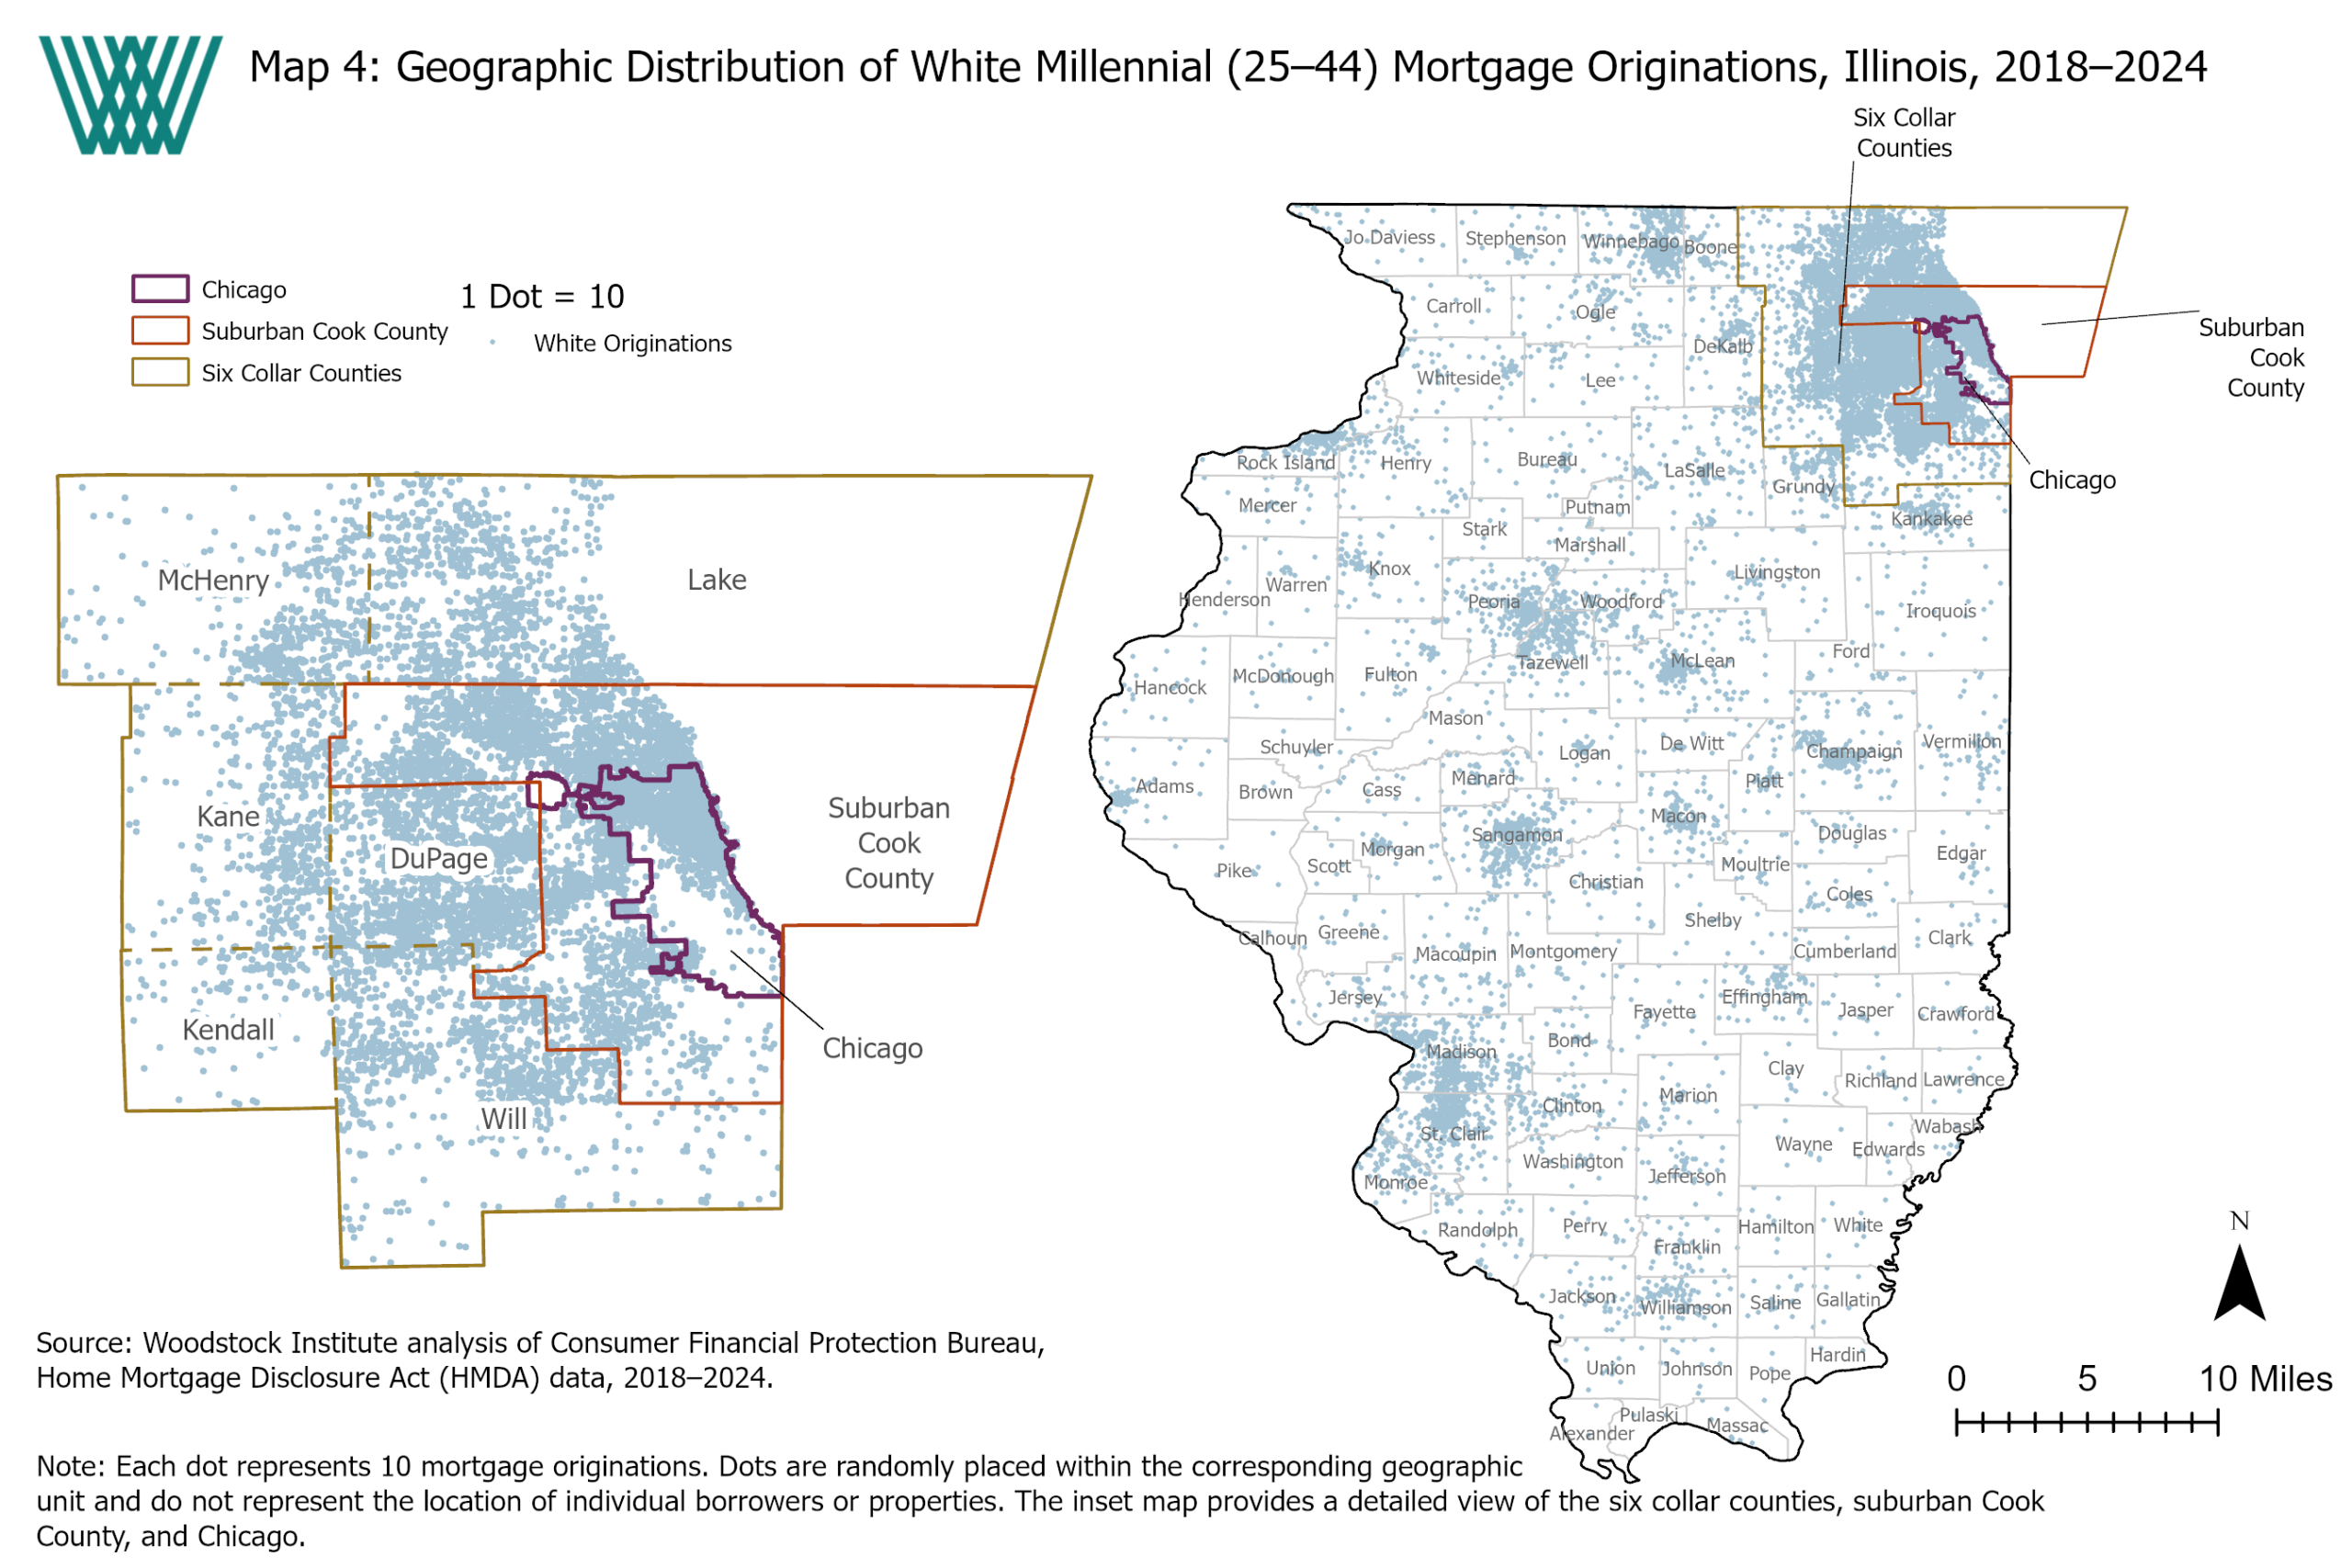
White-Originations-Final.png / .jpg / .jpegCheck the file exists in the graphs folder and that this HTML is opened from a browser with local file access enabled.
Lending activity and outcomes
The financial positioning and property value findings help explain why some applicants may face greater underwriting challenges. The next step is to understand the loan outcomes of borrowers in the above financial situations. In Illinois, 25- to 44-year-old applicants represented 62.5 percent, or 828,144, of loan applications from 2018 to 2024, making this age group leaders in the state’s mortgage market. As first-time homeowners get older, it is important to assess how this age group is treated by lenders to understand the future of homeownership.
Origination rates
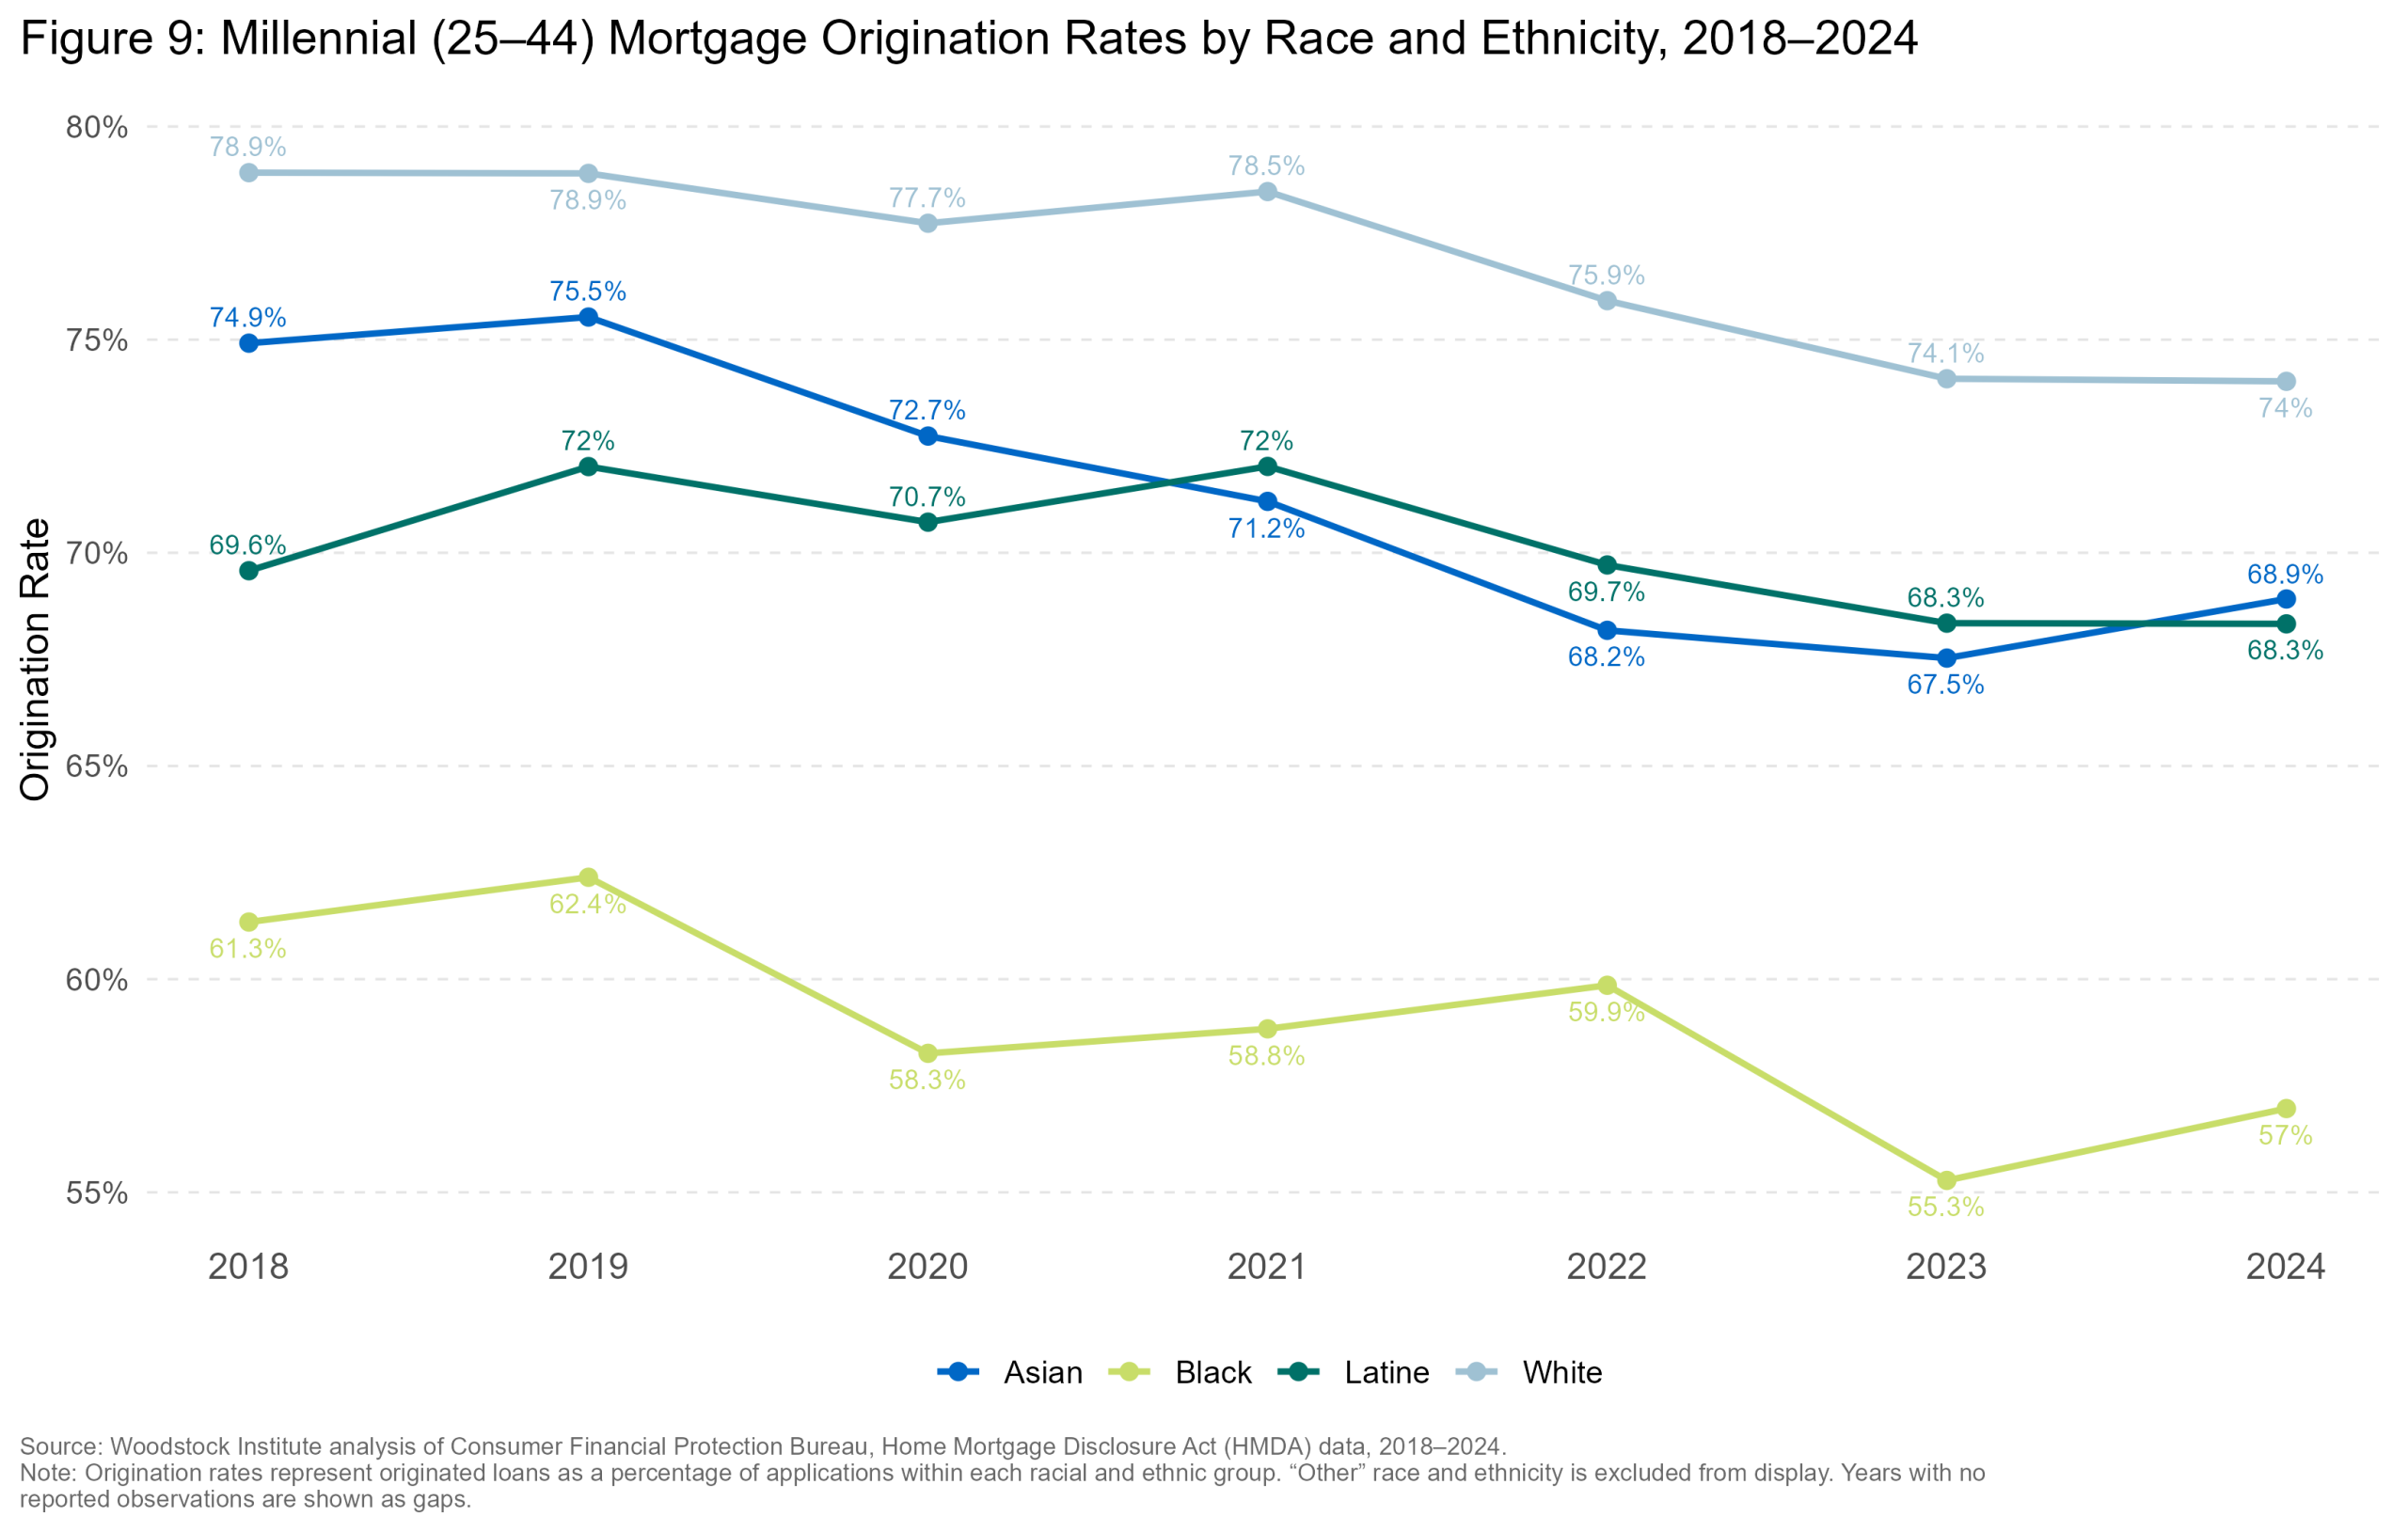
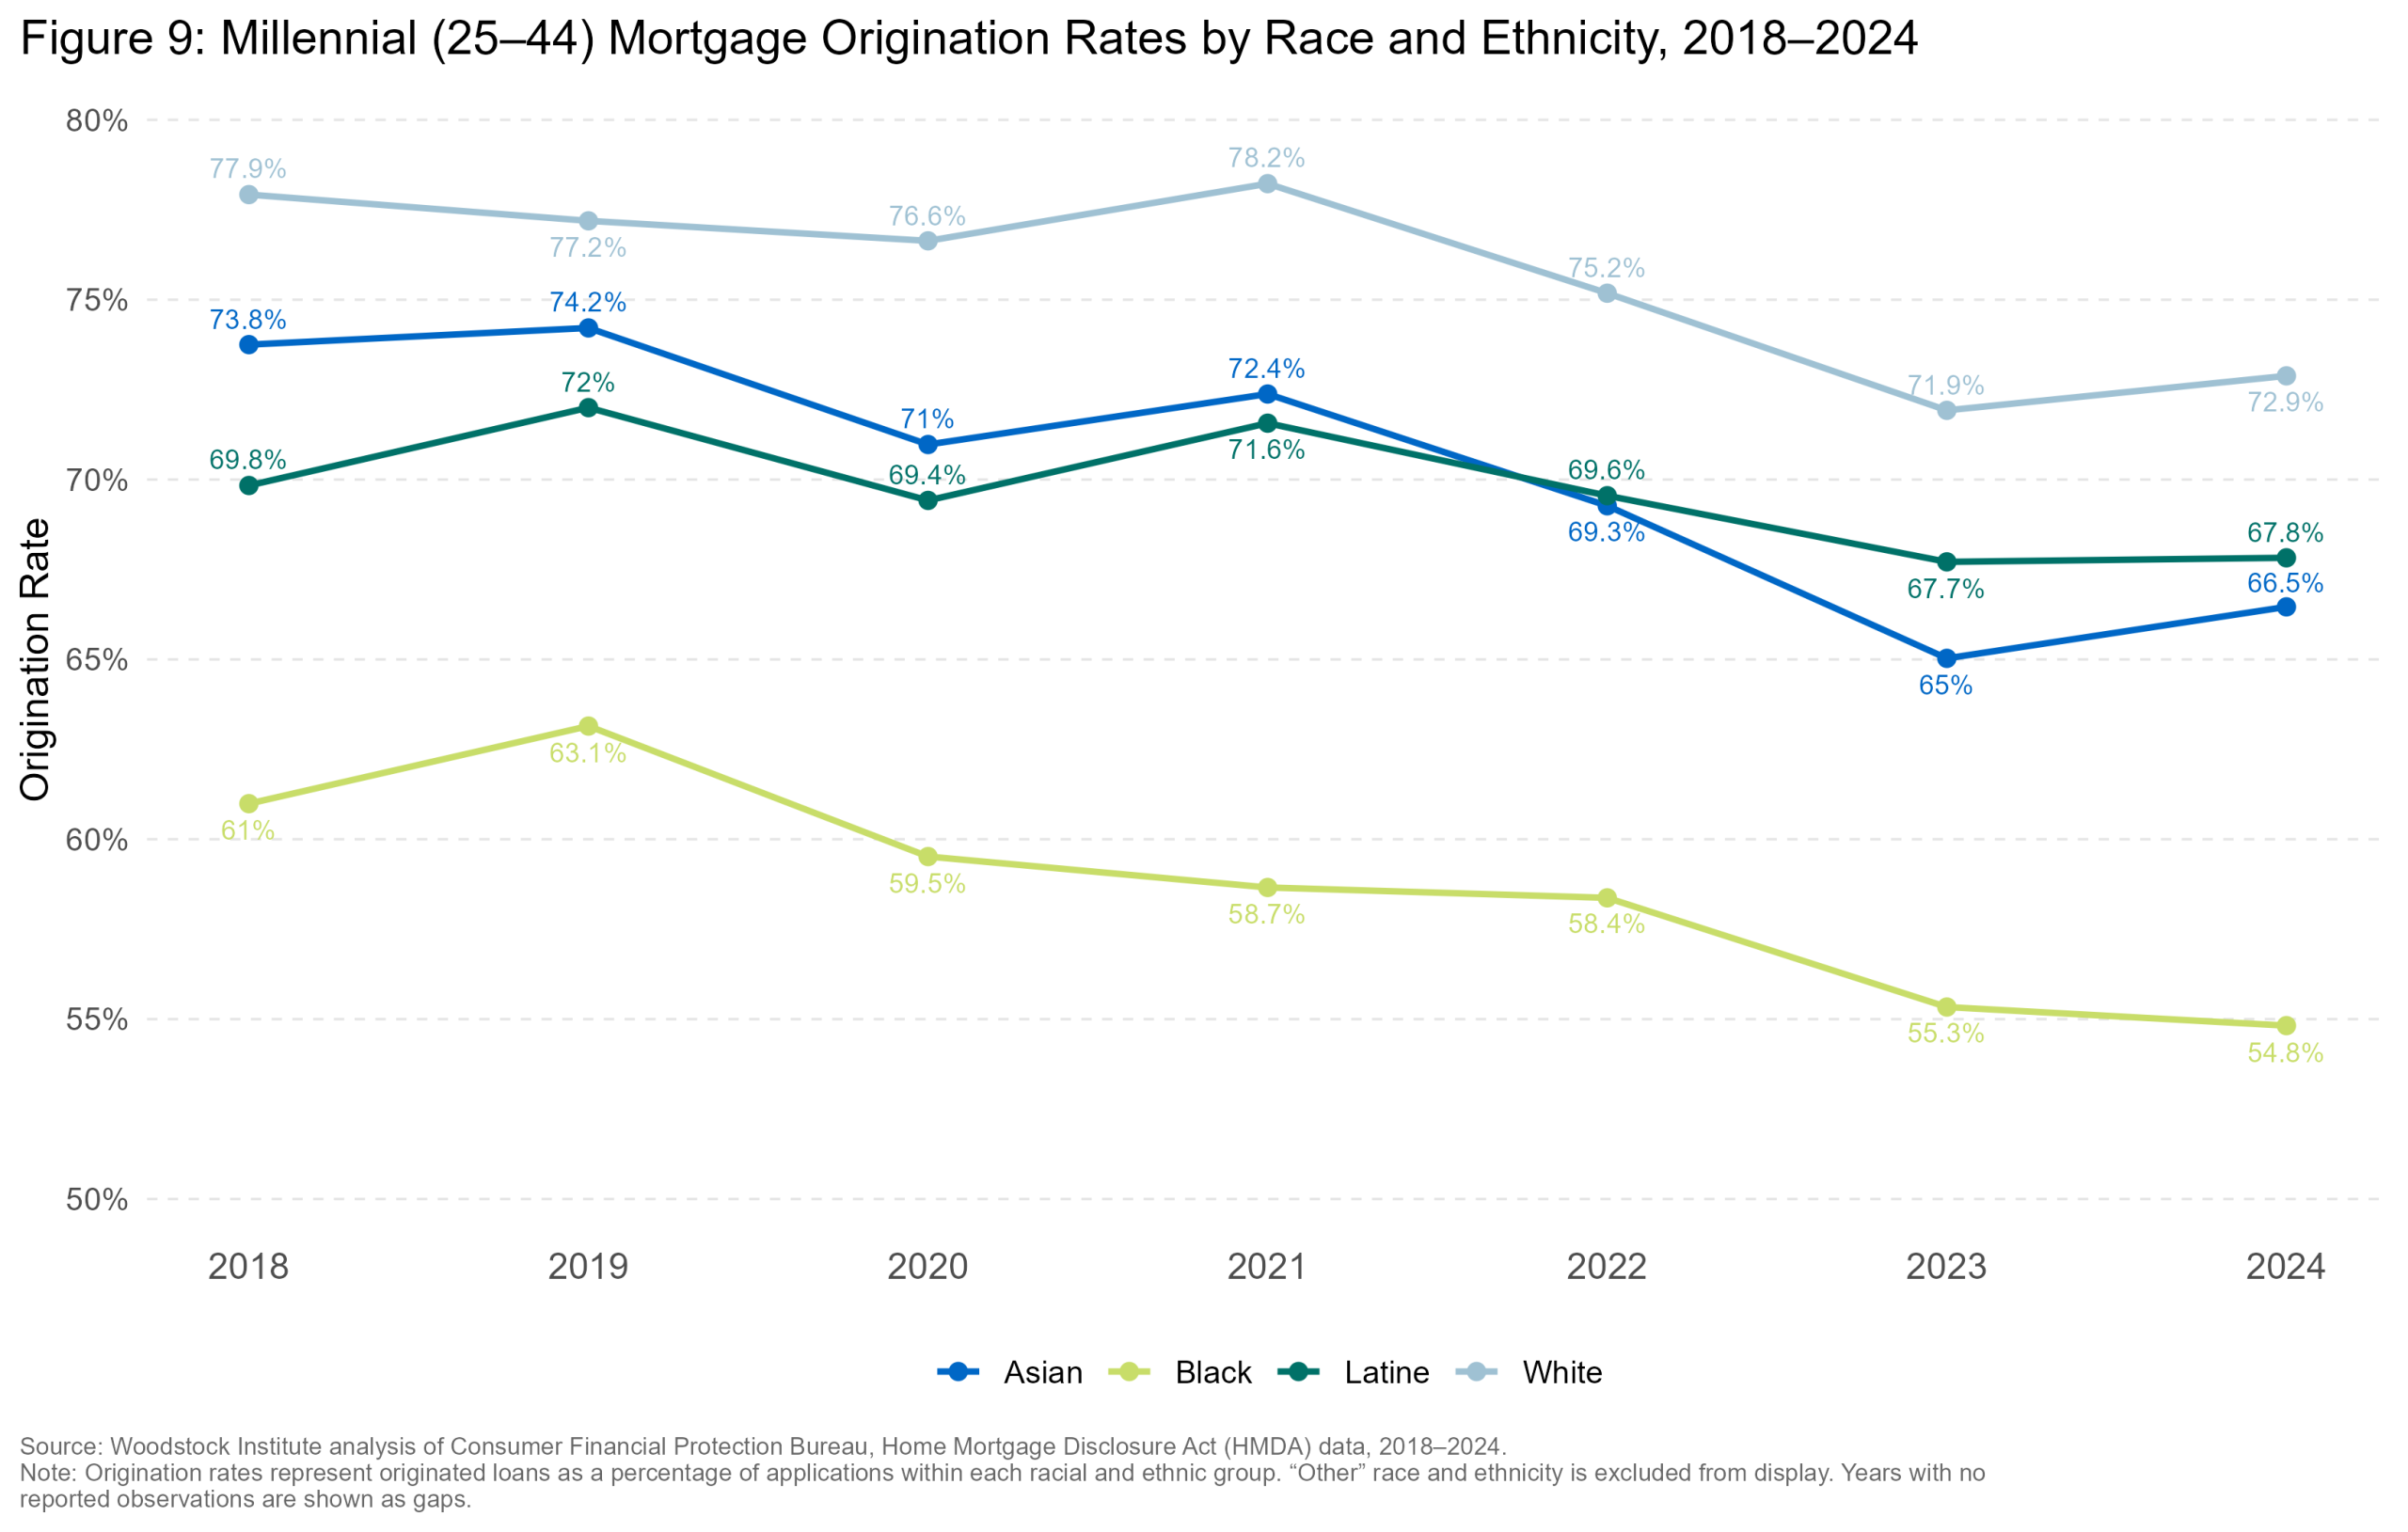
Across Illinois, the origination rate gap between White and Black millennial applicants was wider than any other racial comparison, reaching 17.6 percentage points in 2024. Asian and Latine applicants fell in between, trailing White applicants by less than seven points. From 2021 to 2024, Asian applicants’ origination rates fell below Latine applicants. Statewide, the Black millennial origination rates fell 6.1 percentage points from 2018 to 2024, compared with only a 3.2-point decline for White applicants, contributing to an increased gap in origination rates. Out of all geographies, Chicago had the highest origination rate disparity, with an 18.1 percentage point gap between White and Black applicants. The origination rate gap between Black and White applicants has widened in almost all geographies since 2018. (Figure 9)
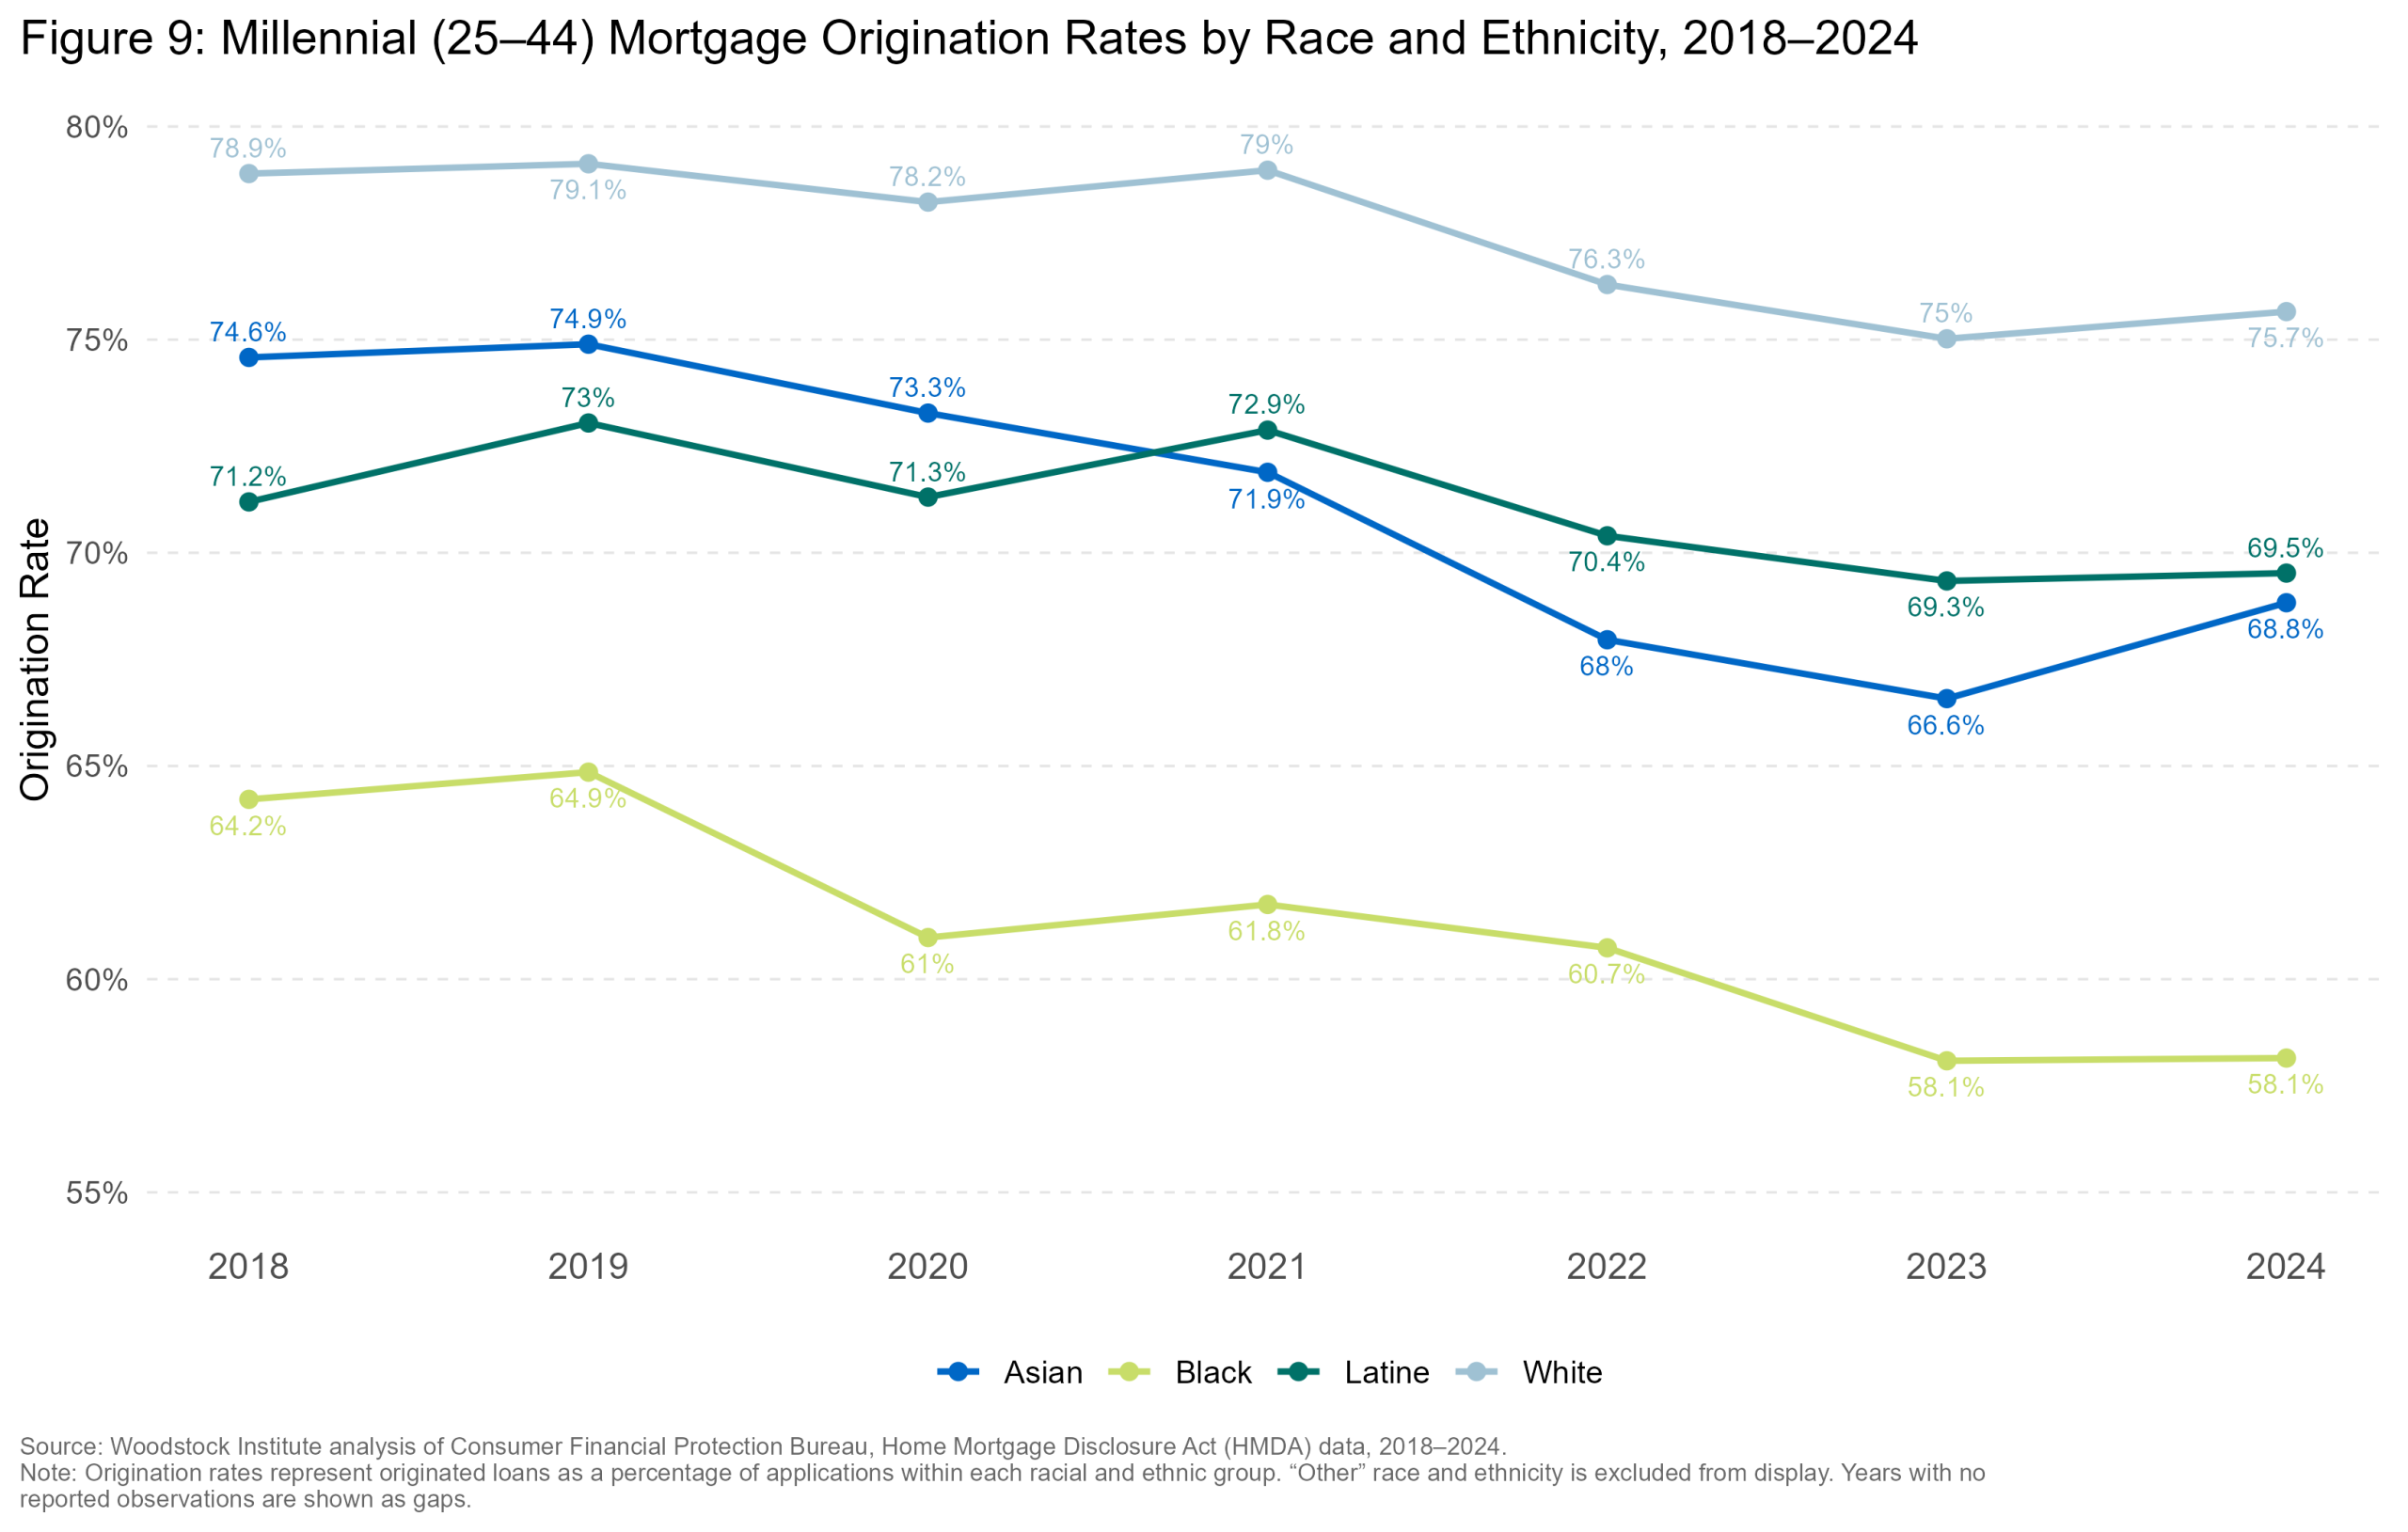
make_orig_chart_Illinois.png / .jpg / .jpegCheck the file exists in the graphs folder and that this HTML is opened from a browser with local file access enabled.
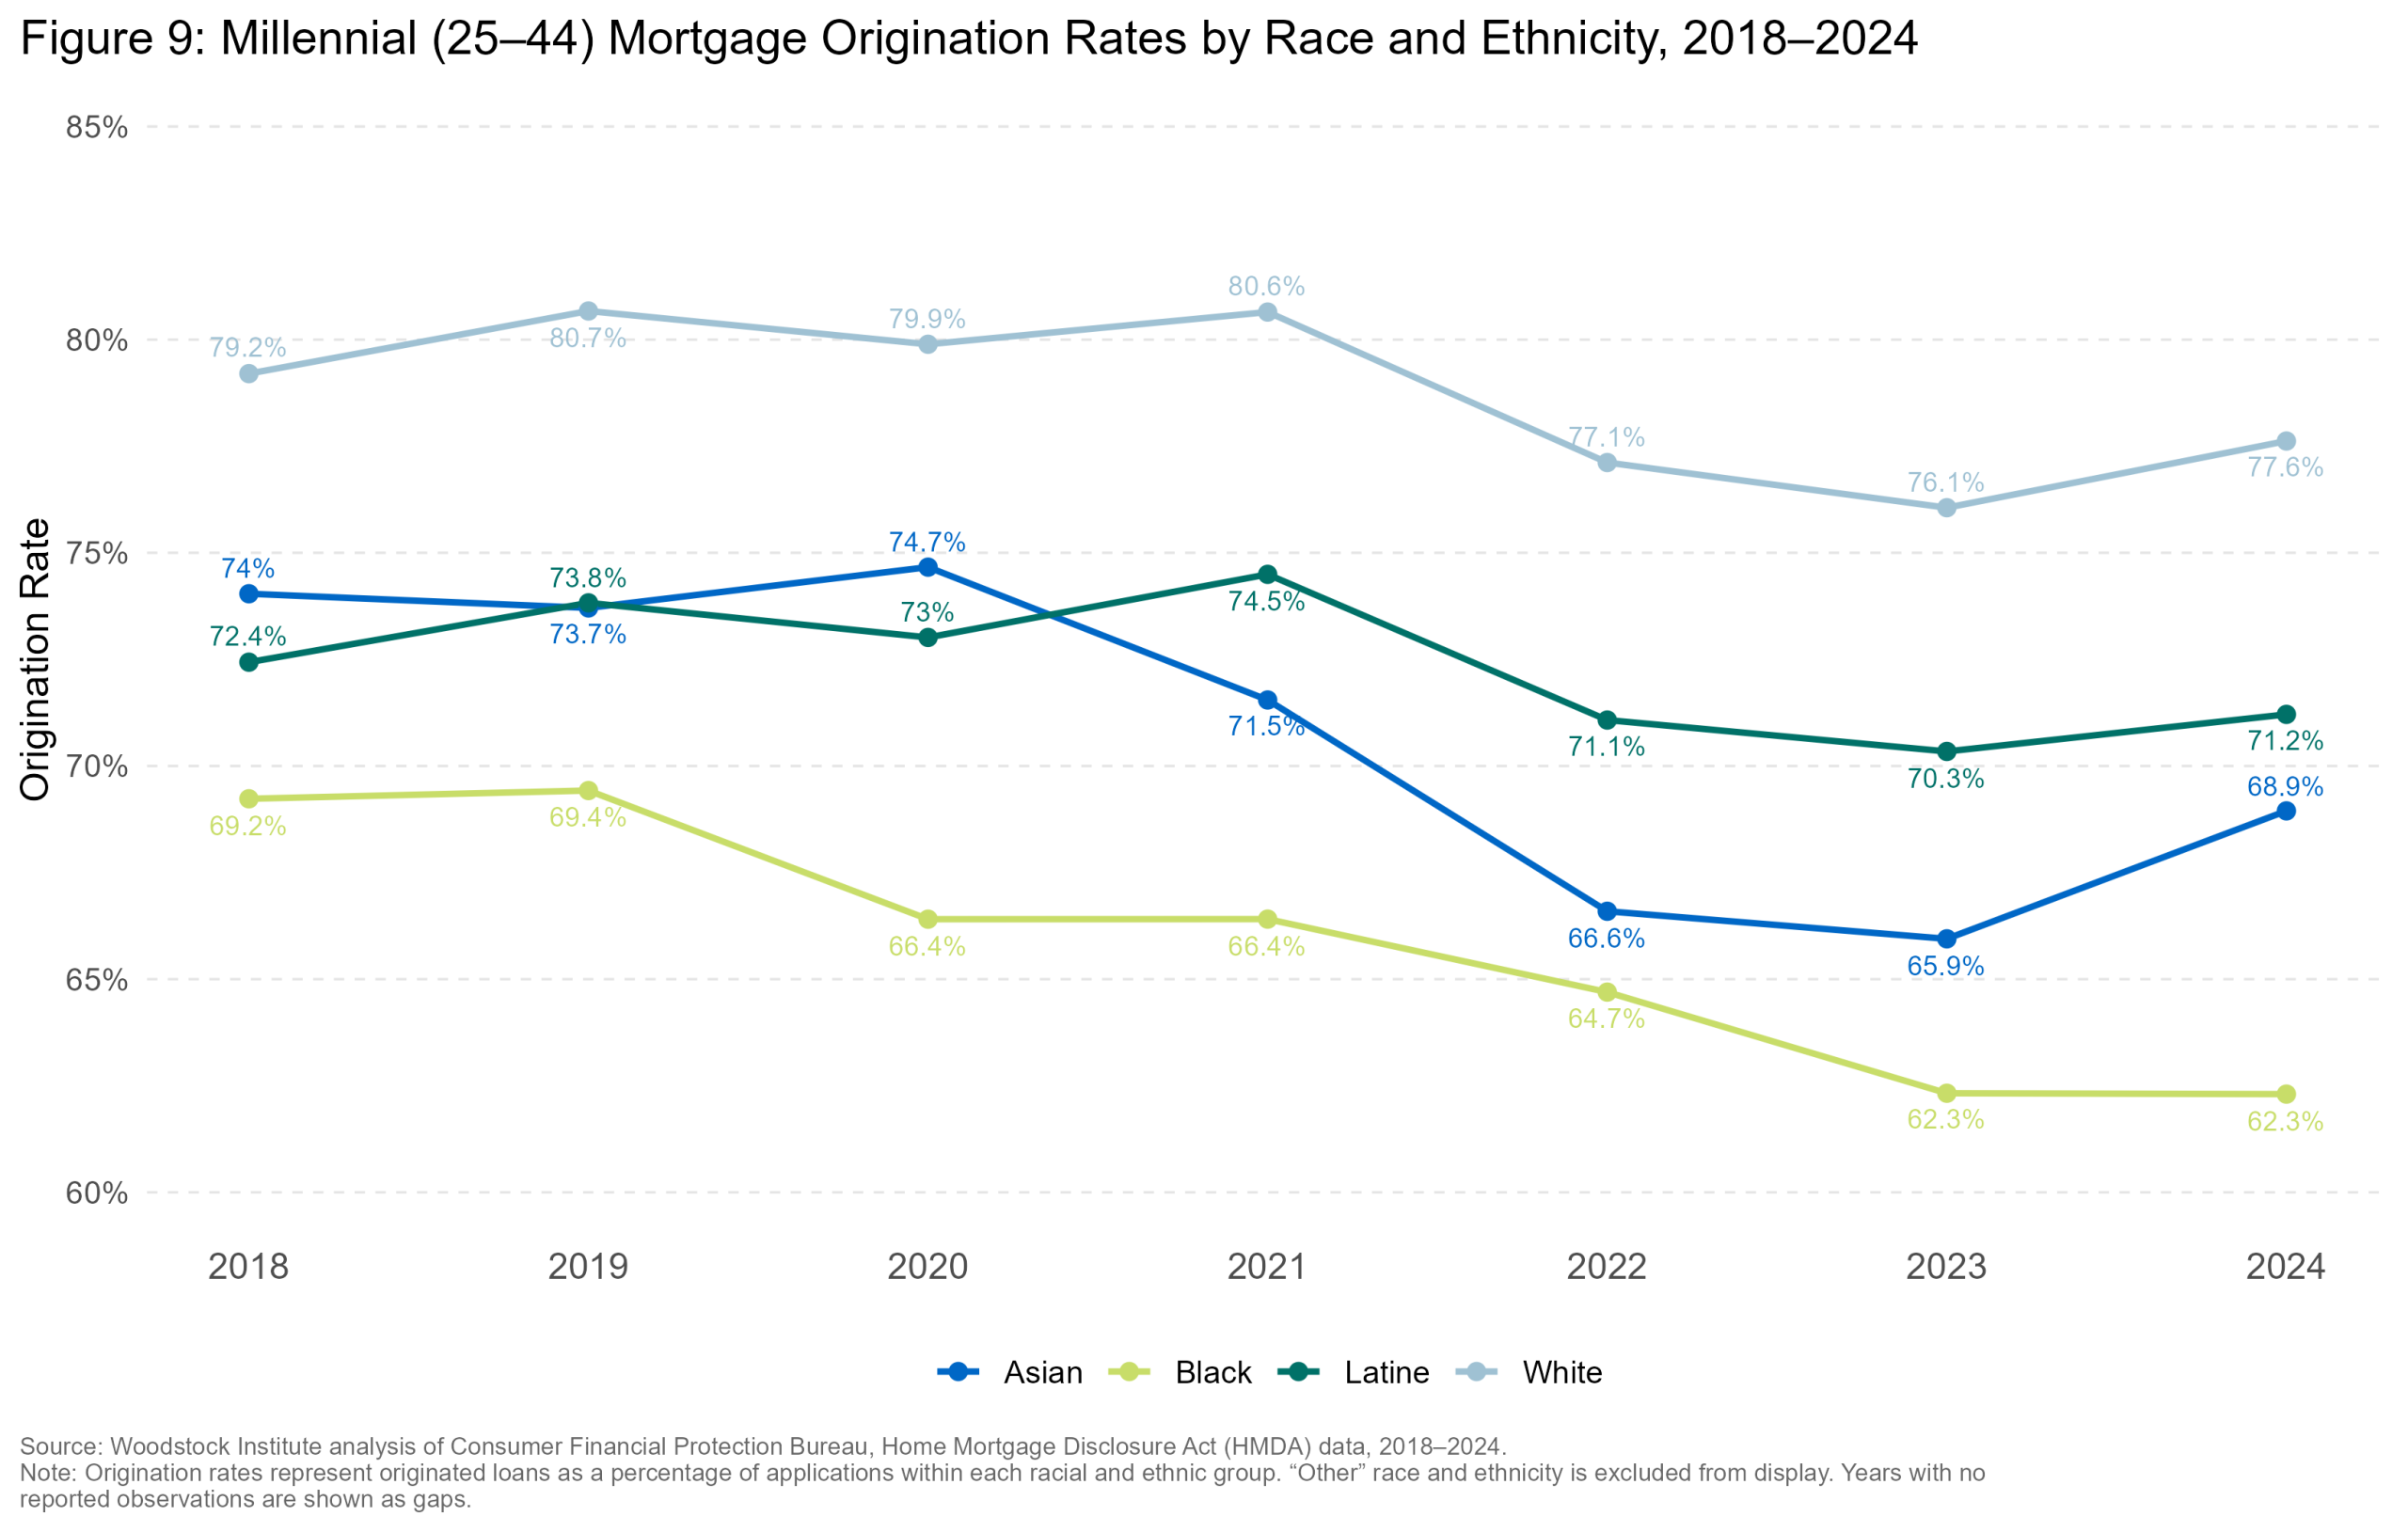
make_orig_chart_Six_Collar.png / .jpg / .jpegCheck the file exists in the graphs folder and that this HTML is opened from a browser with local file access enabled.
make_orig_chart_Suburban_Cook.png / .jpg / .jpegCheck the file exists in the graphs folder and that this HTML is opened from a browser with local file access enabled.
make_orig_chart_Chicago.png / .jpg / .jpegCheck the file exists in the graphs folder and that this HTML is opened from a browser with local file access enabled.
Well-qualified25 applicants
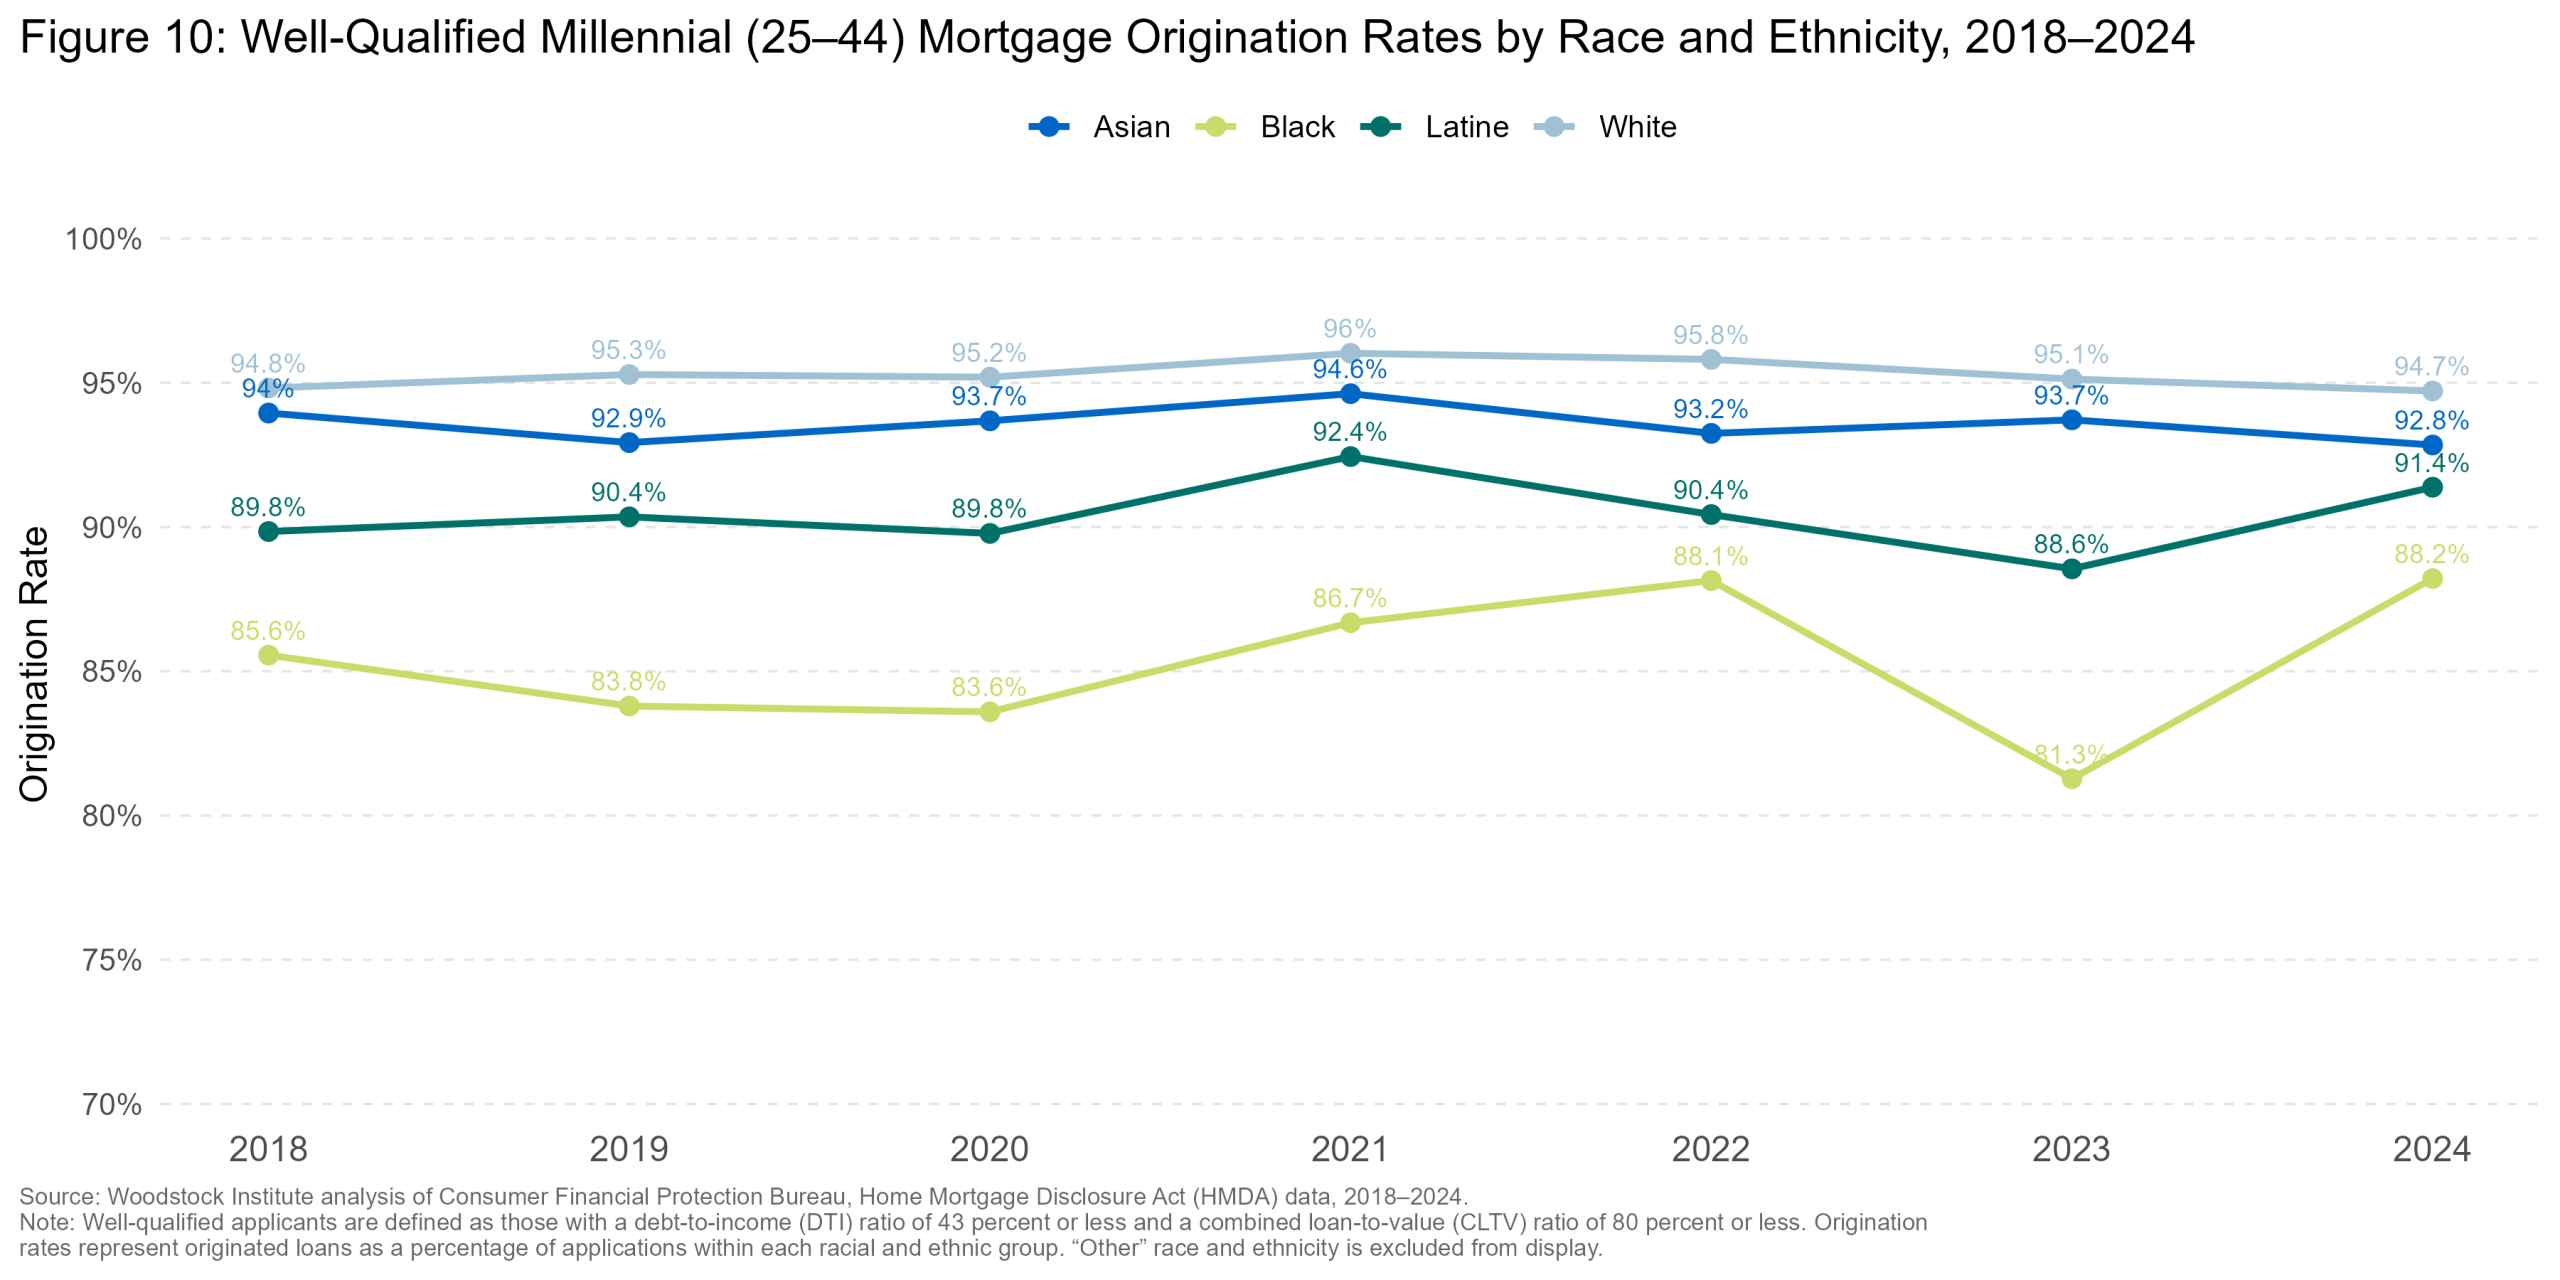
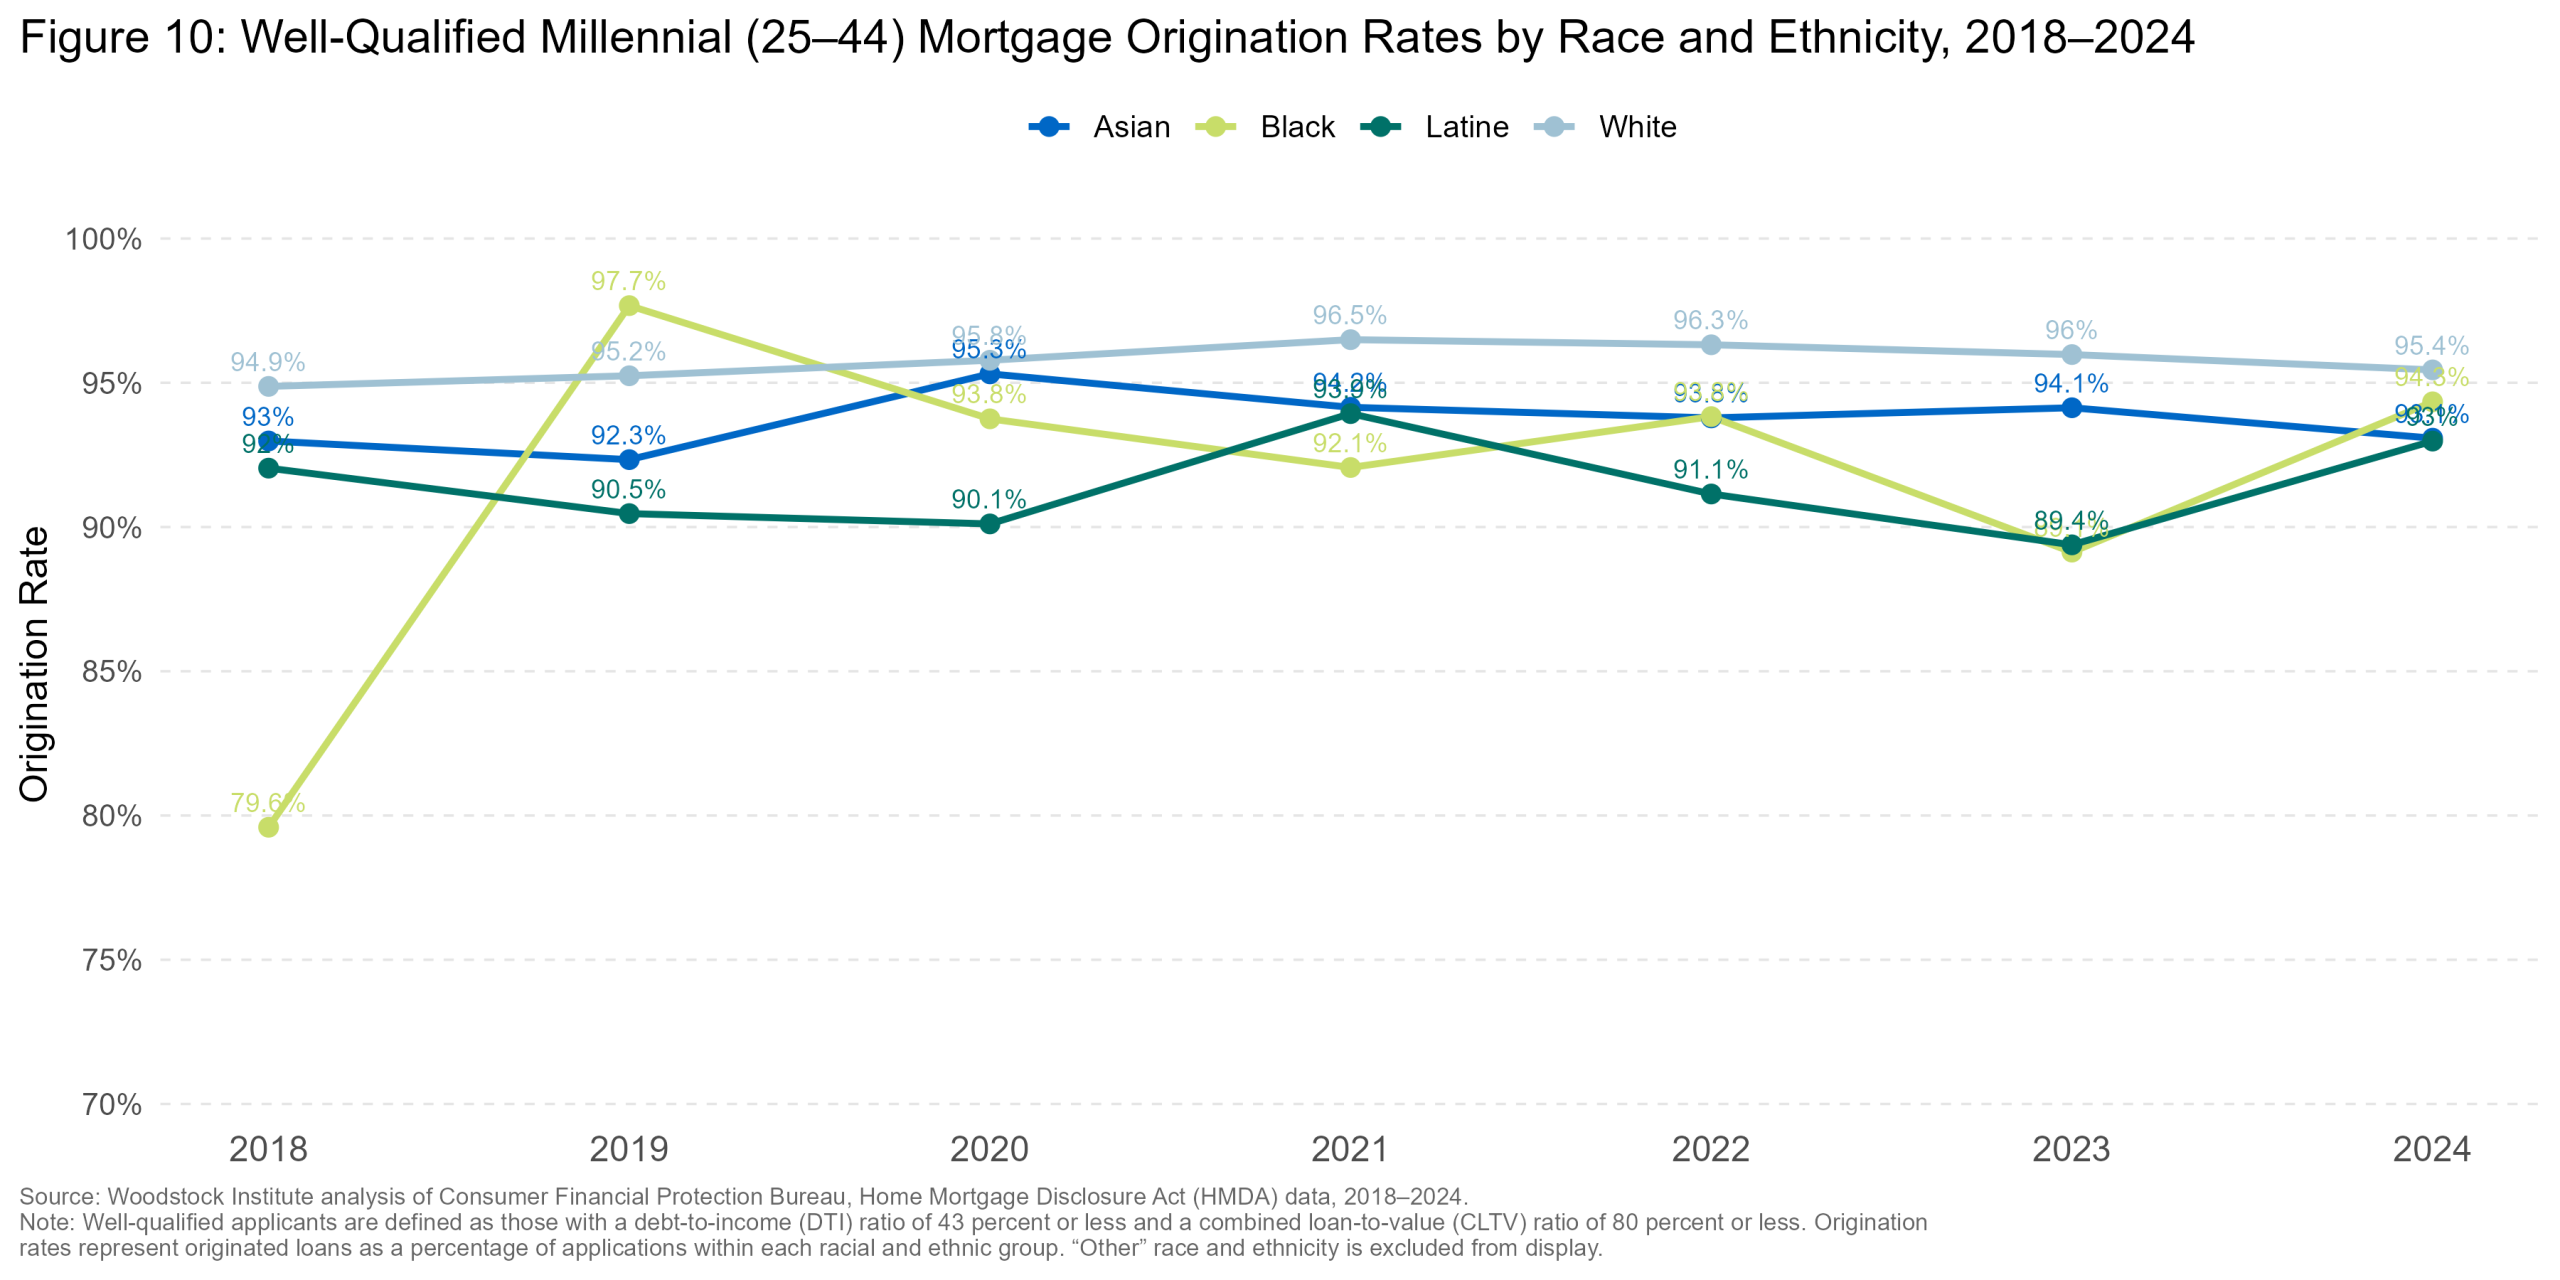
The high DTI and CLTV described previously may explain part of the overall origination gap, but they do not explain it fully. Among well-qualified applicants, who represent approximately 19 percent of millennial applicants, origination rates are higher than the general millennial population, but the racial disparity still exists. Statewide, in 2024, Black well-qualified applicants had the lowest origination rates across Illinois at 88.2 percent, compared to White applicants at 94.7 percent, a gap of 6.5 percentage points. That gap is most severe in suburban Cook County, where the disparity between White and Black applicants reached 14.6 percentage points in 2024. The six collar counties show the narrowest spread among well-qualified borrowers, with just a 2.4-point gap between the highest (White applicants) and lowest (Latine applicants) rates in 2024. Even amongst borrowers with similar debt burdens and levels of leverage, differences in origination rates persist, indicating that these financial factors alone do not fully explain the disparities. (Figure 10)
well_qualified_origination_rate_trend_Illinois.png / .jpg / .jpegCheck the file exists in the graphs folder and that this HTML is opened from a browser with local file access enabled.
well_qualified_origination_rate_trend_Six_Collar.png / .jpg / .jpegCheck the file exists in the graphs folder and that this HTML is opened from a browser with local file access enabled.
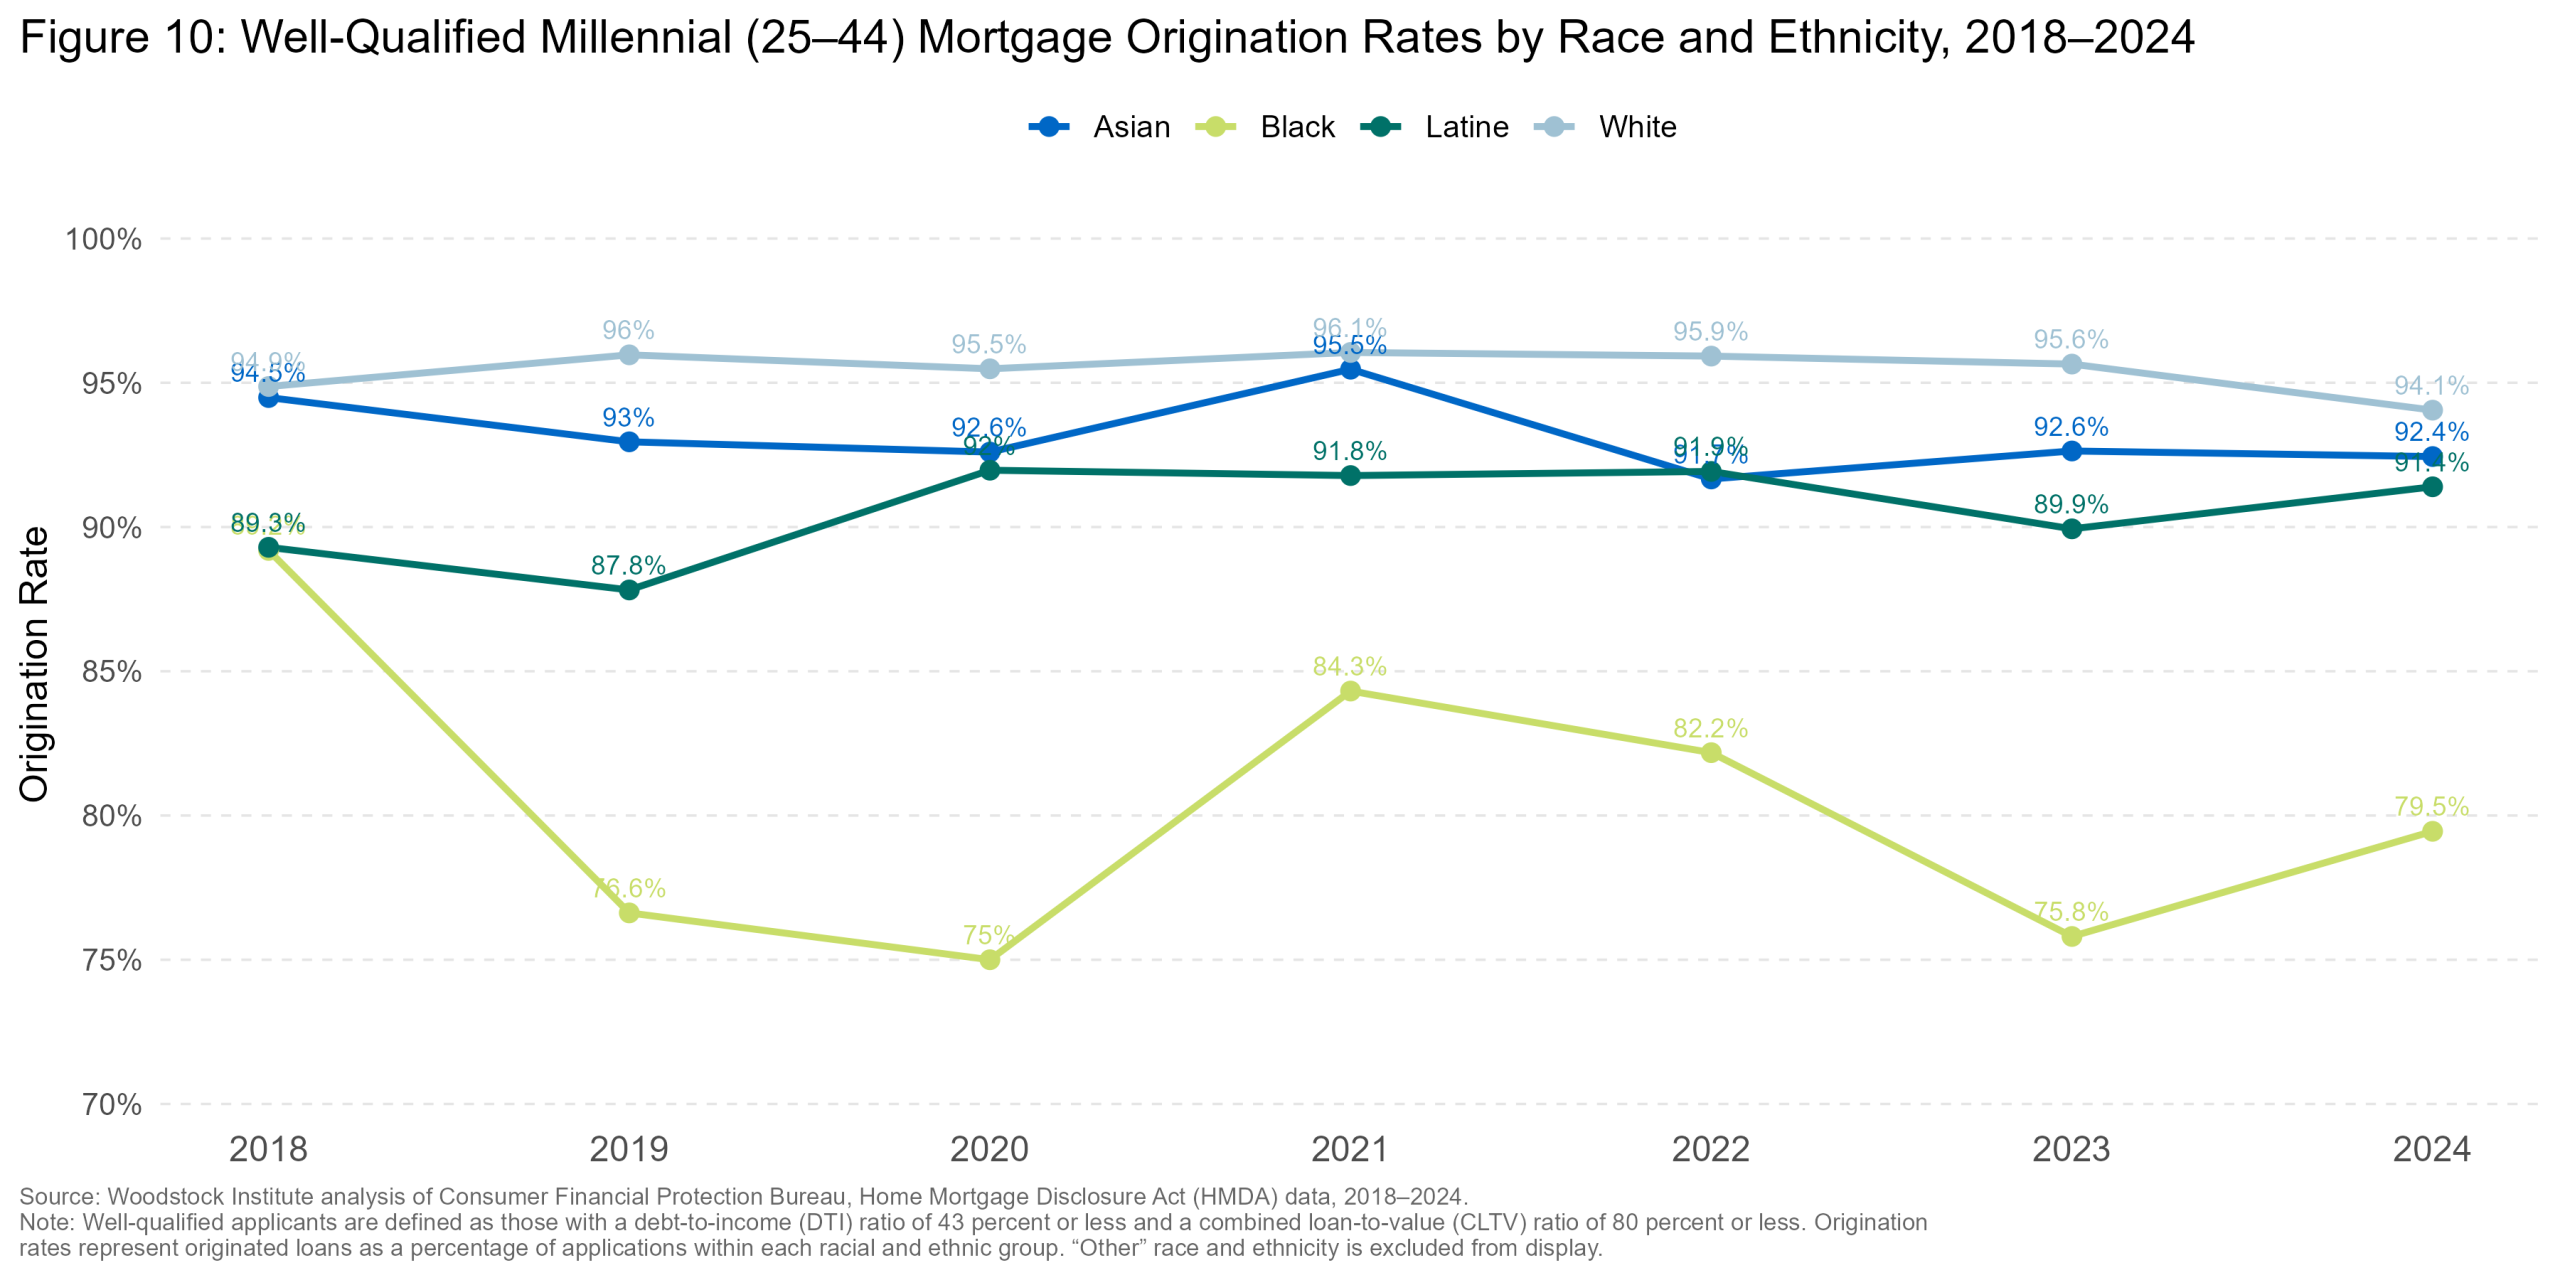
well_qualified_origination_rate_trend_Suburban_Cook.png / .jpg / .jpegCheck the file exists in the graphs folder and that this HTML is opened from a browser with local file access enabled.
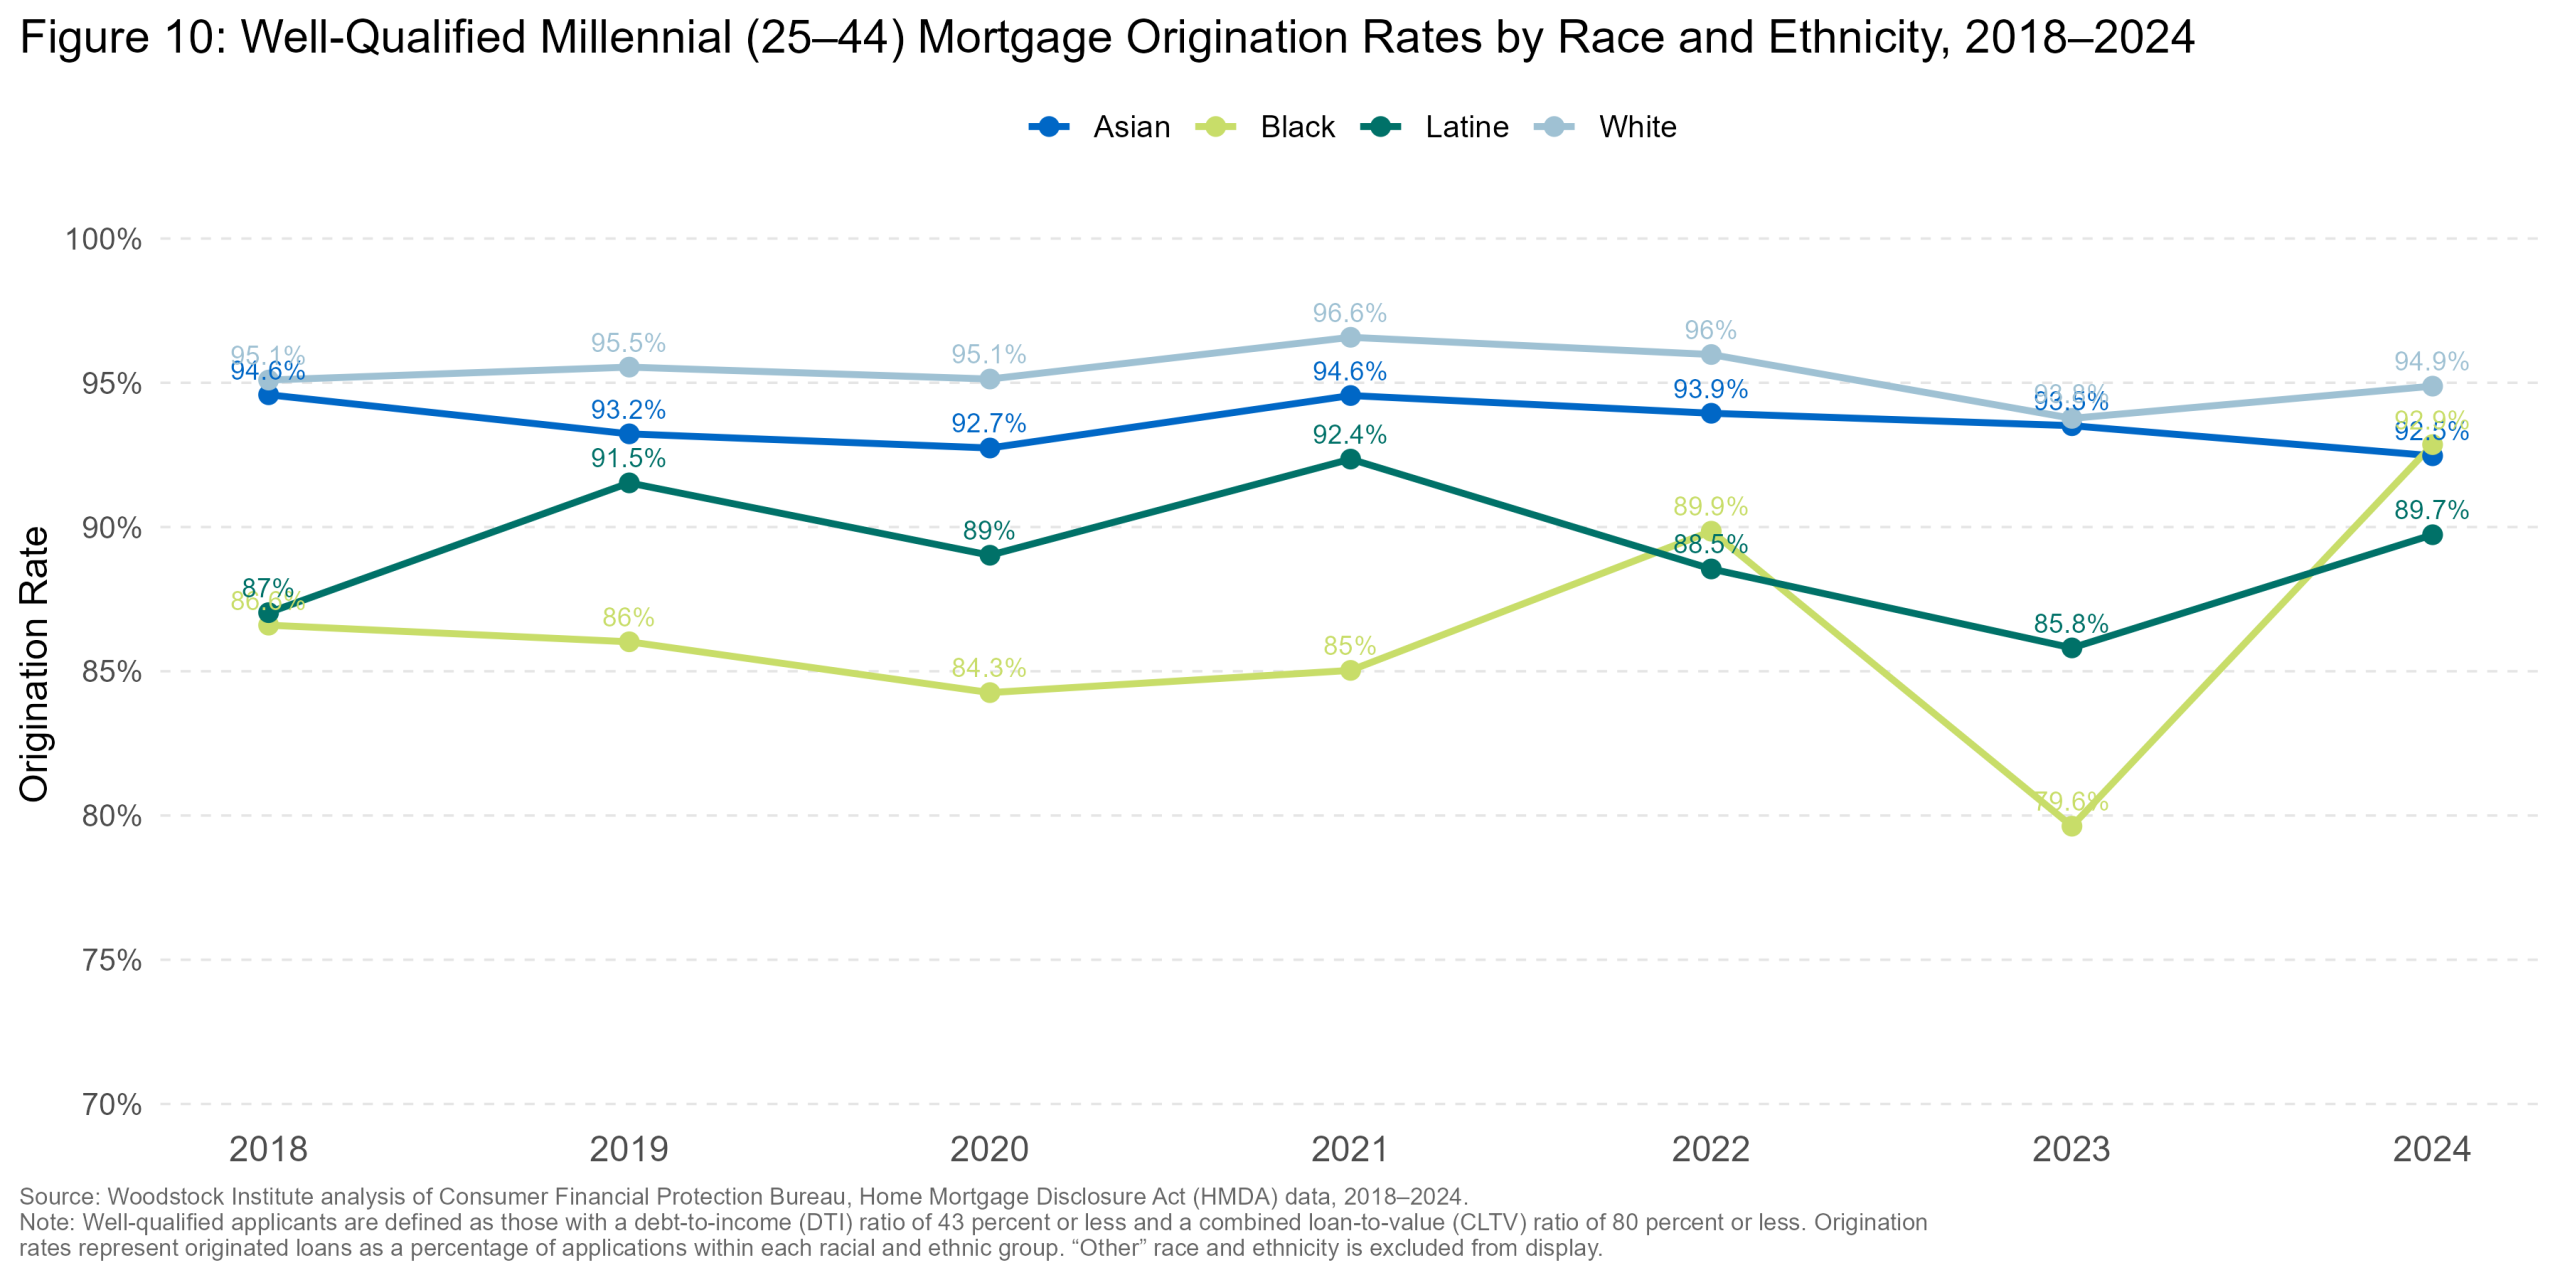
well_qualified_origination_rate_trend_Chicago.png / .jpg / .jpegCheck the file exists in the graphs folder and that this HTML is opened from a browser with local file access enabled.
Denial rates
Denial rates mirror origination rate trends: in 2024, Black millennials were denied 2.8 times the rate of White applicants statewide. Latine applicants were denied at about 1.7 times the rate of White applicants. This Black-White gap has widened in every geography since 2018, while the Latine-White gap has narrowed. Statewide, the Black denial rate climbed from 14.6 percent in 2018 to 16.3 percent in 2024, while the White rate held roughly flat near six percent. The disparity is more severe in suburban Cook County, where the Black denial rate reached 18.3 percent, more than three times the White rate of 5.4 percent. And in Chicago, Black applicants were denied at 15.2 percent compared to just 3.7 percent for White applicants. Even in the six collar counties, Black millennial applicants were denied at roughly triple the rate of White millennial applicants in 2024. (Figure 11)
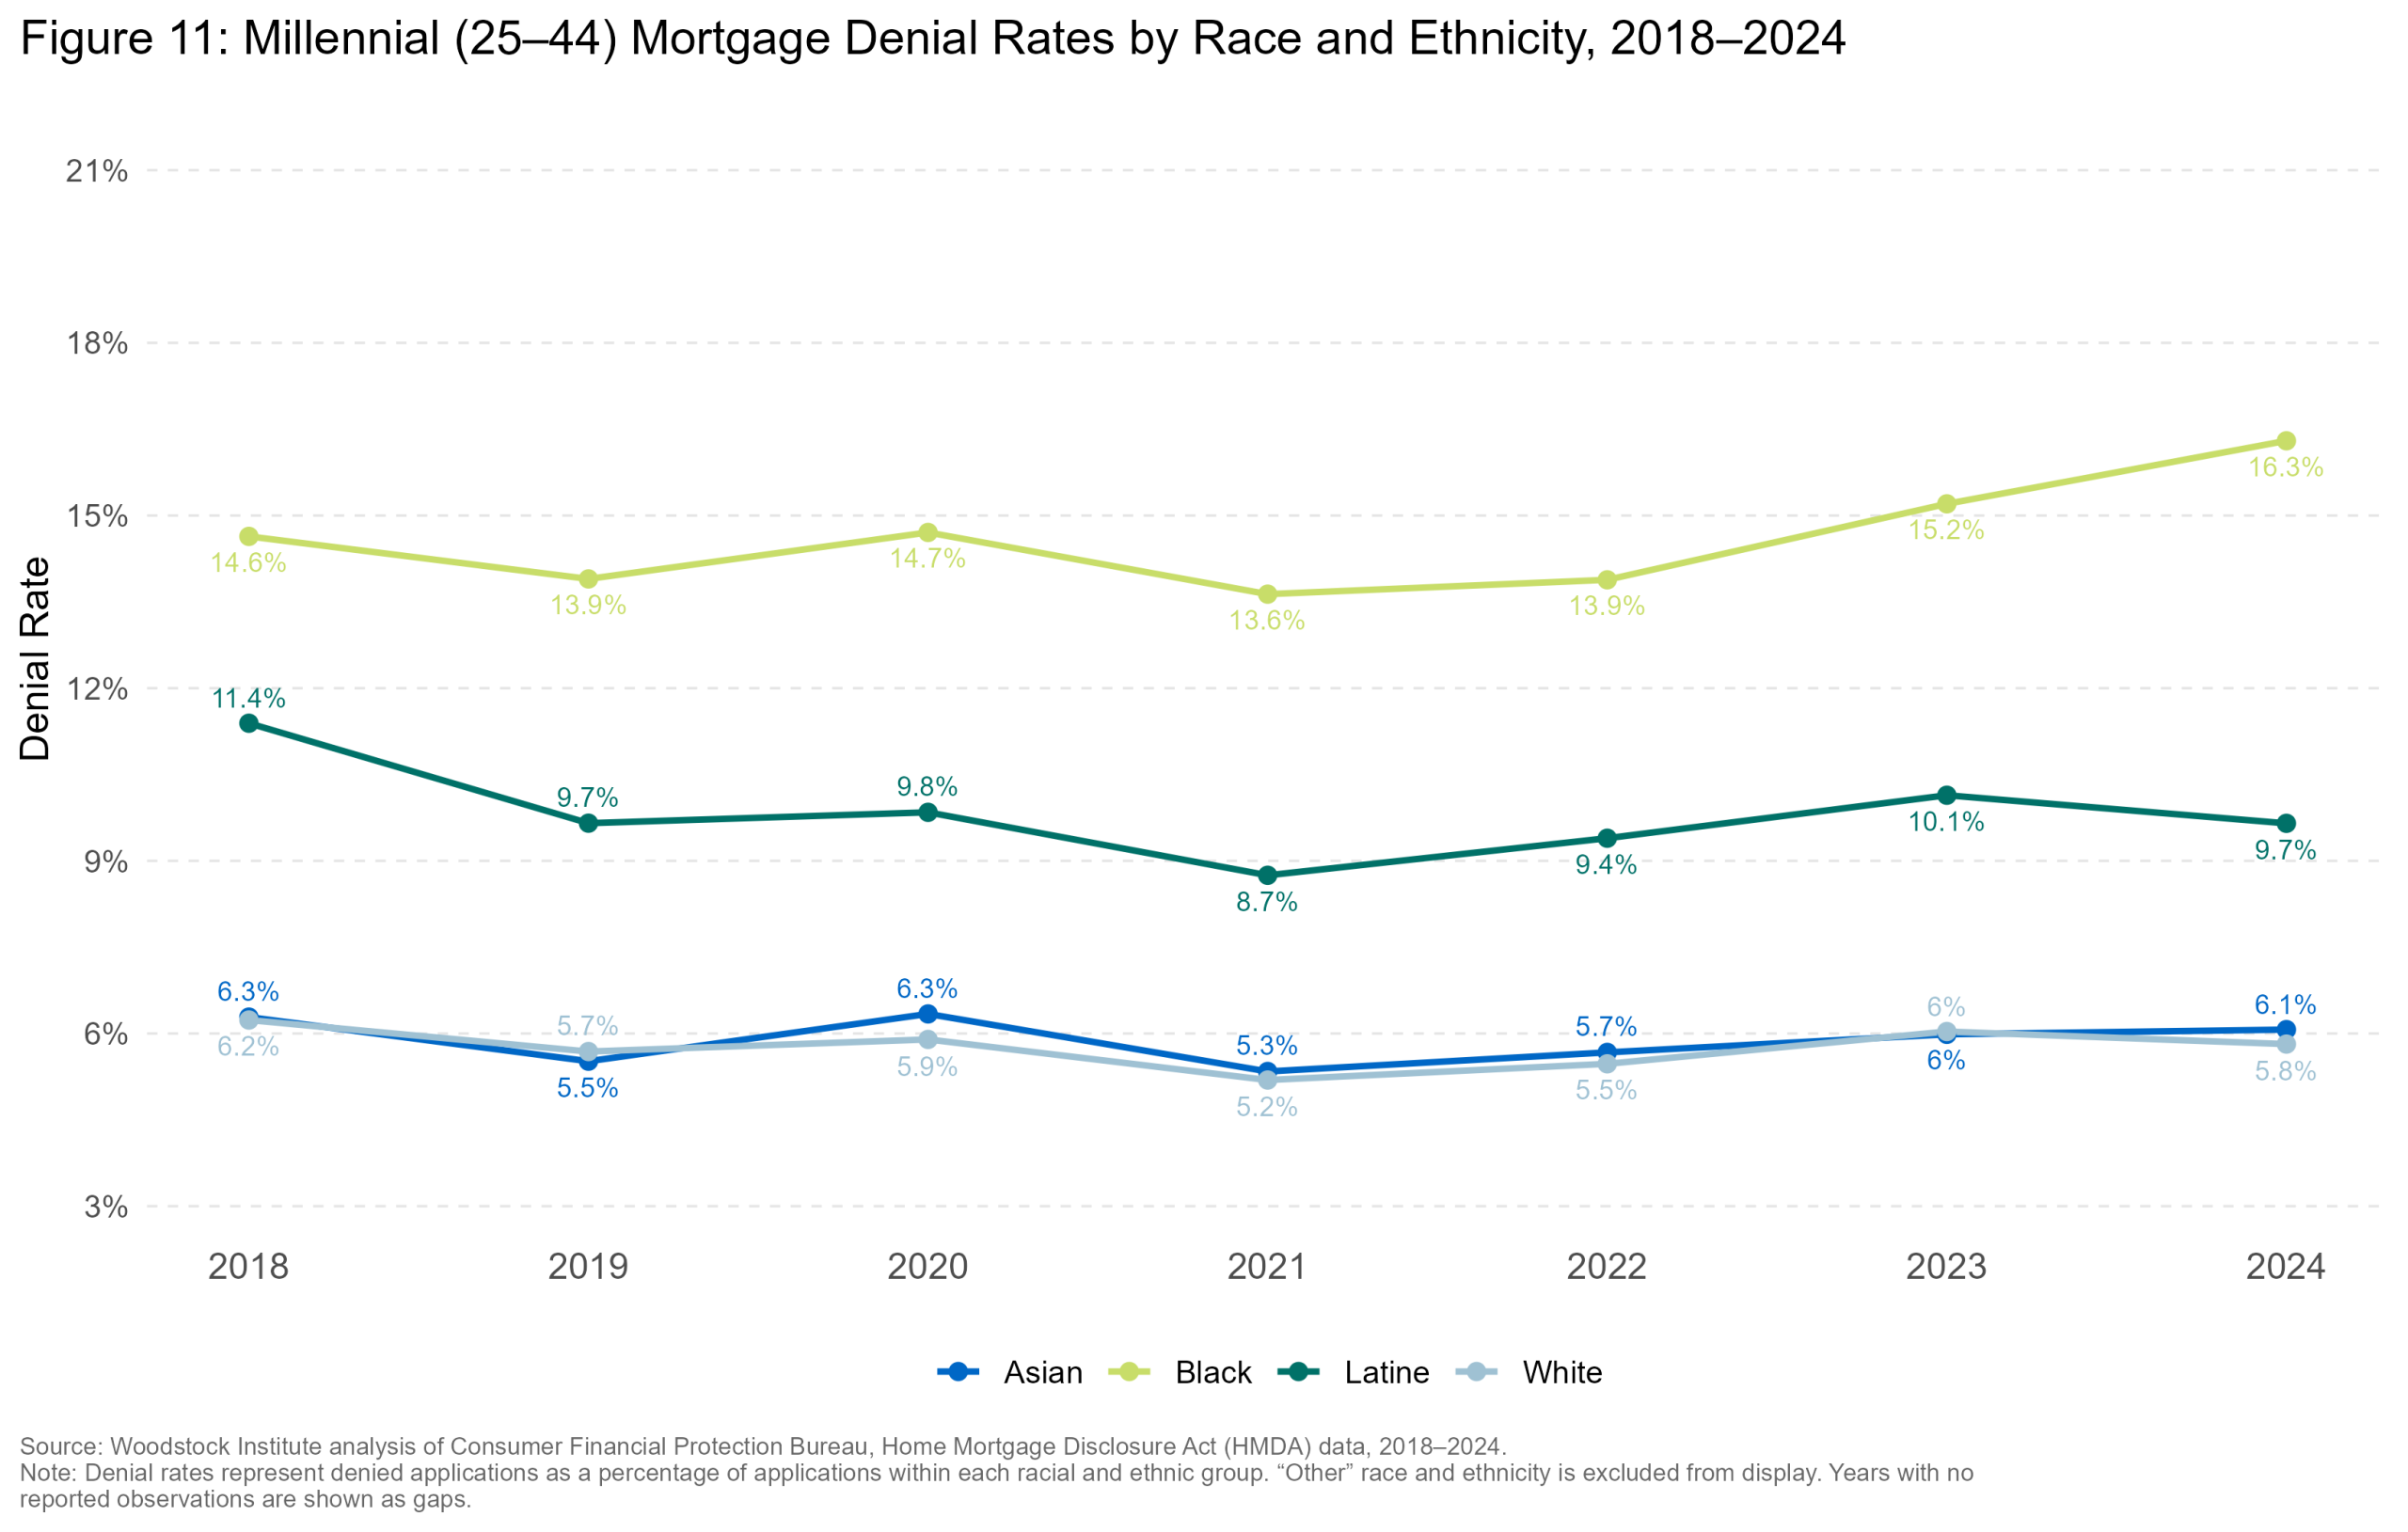
make_denial_chart_Illinois.png / .jpg / .jpegCheck the file exists in the graphs folder and that this HTML is opened from a browser with local file access enabled.
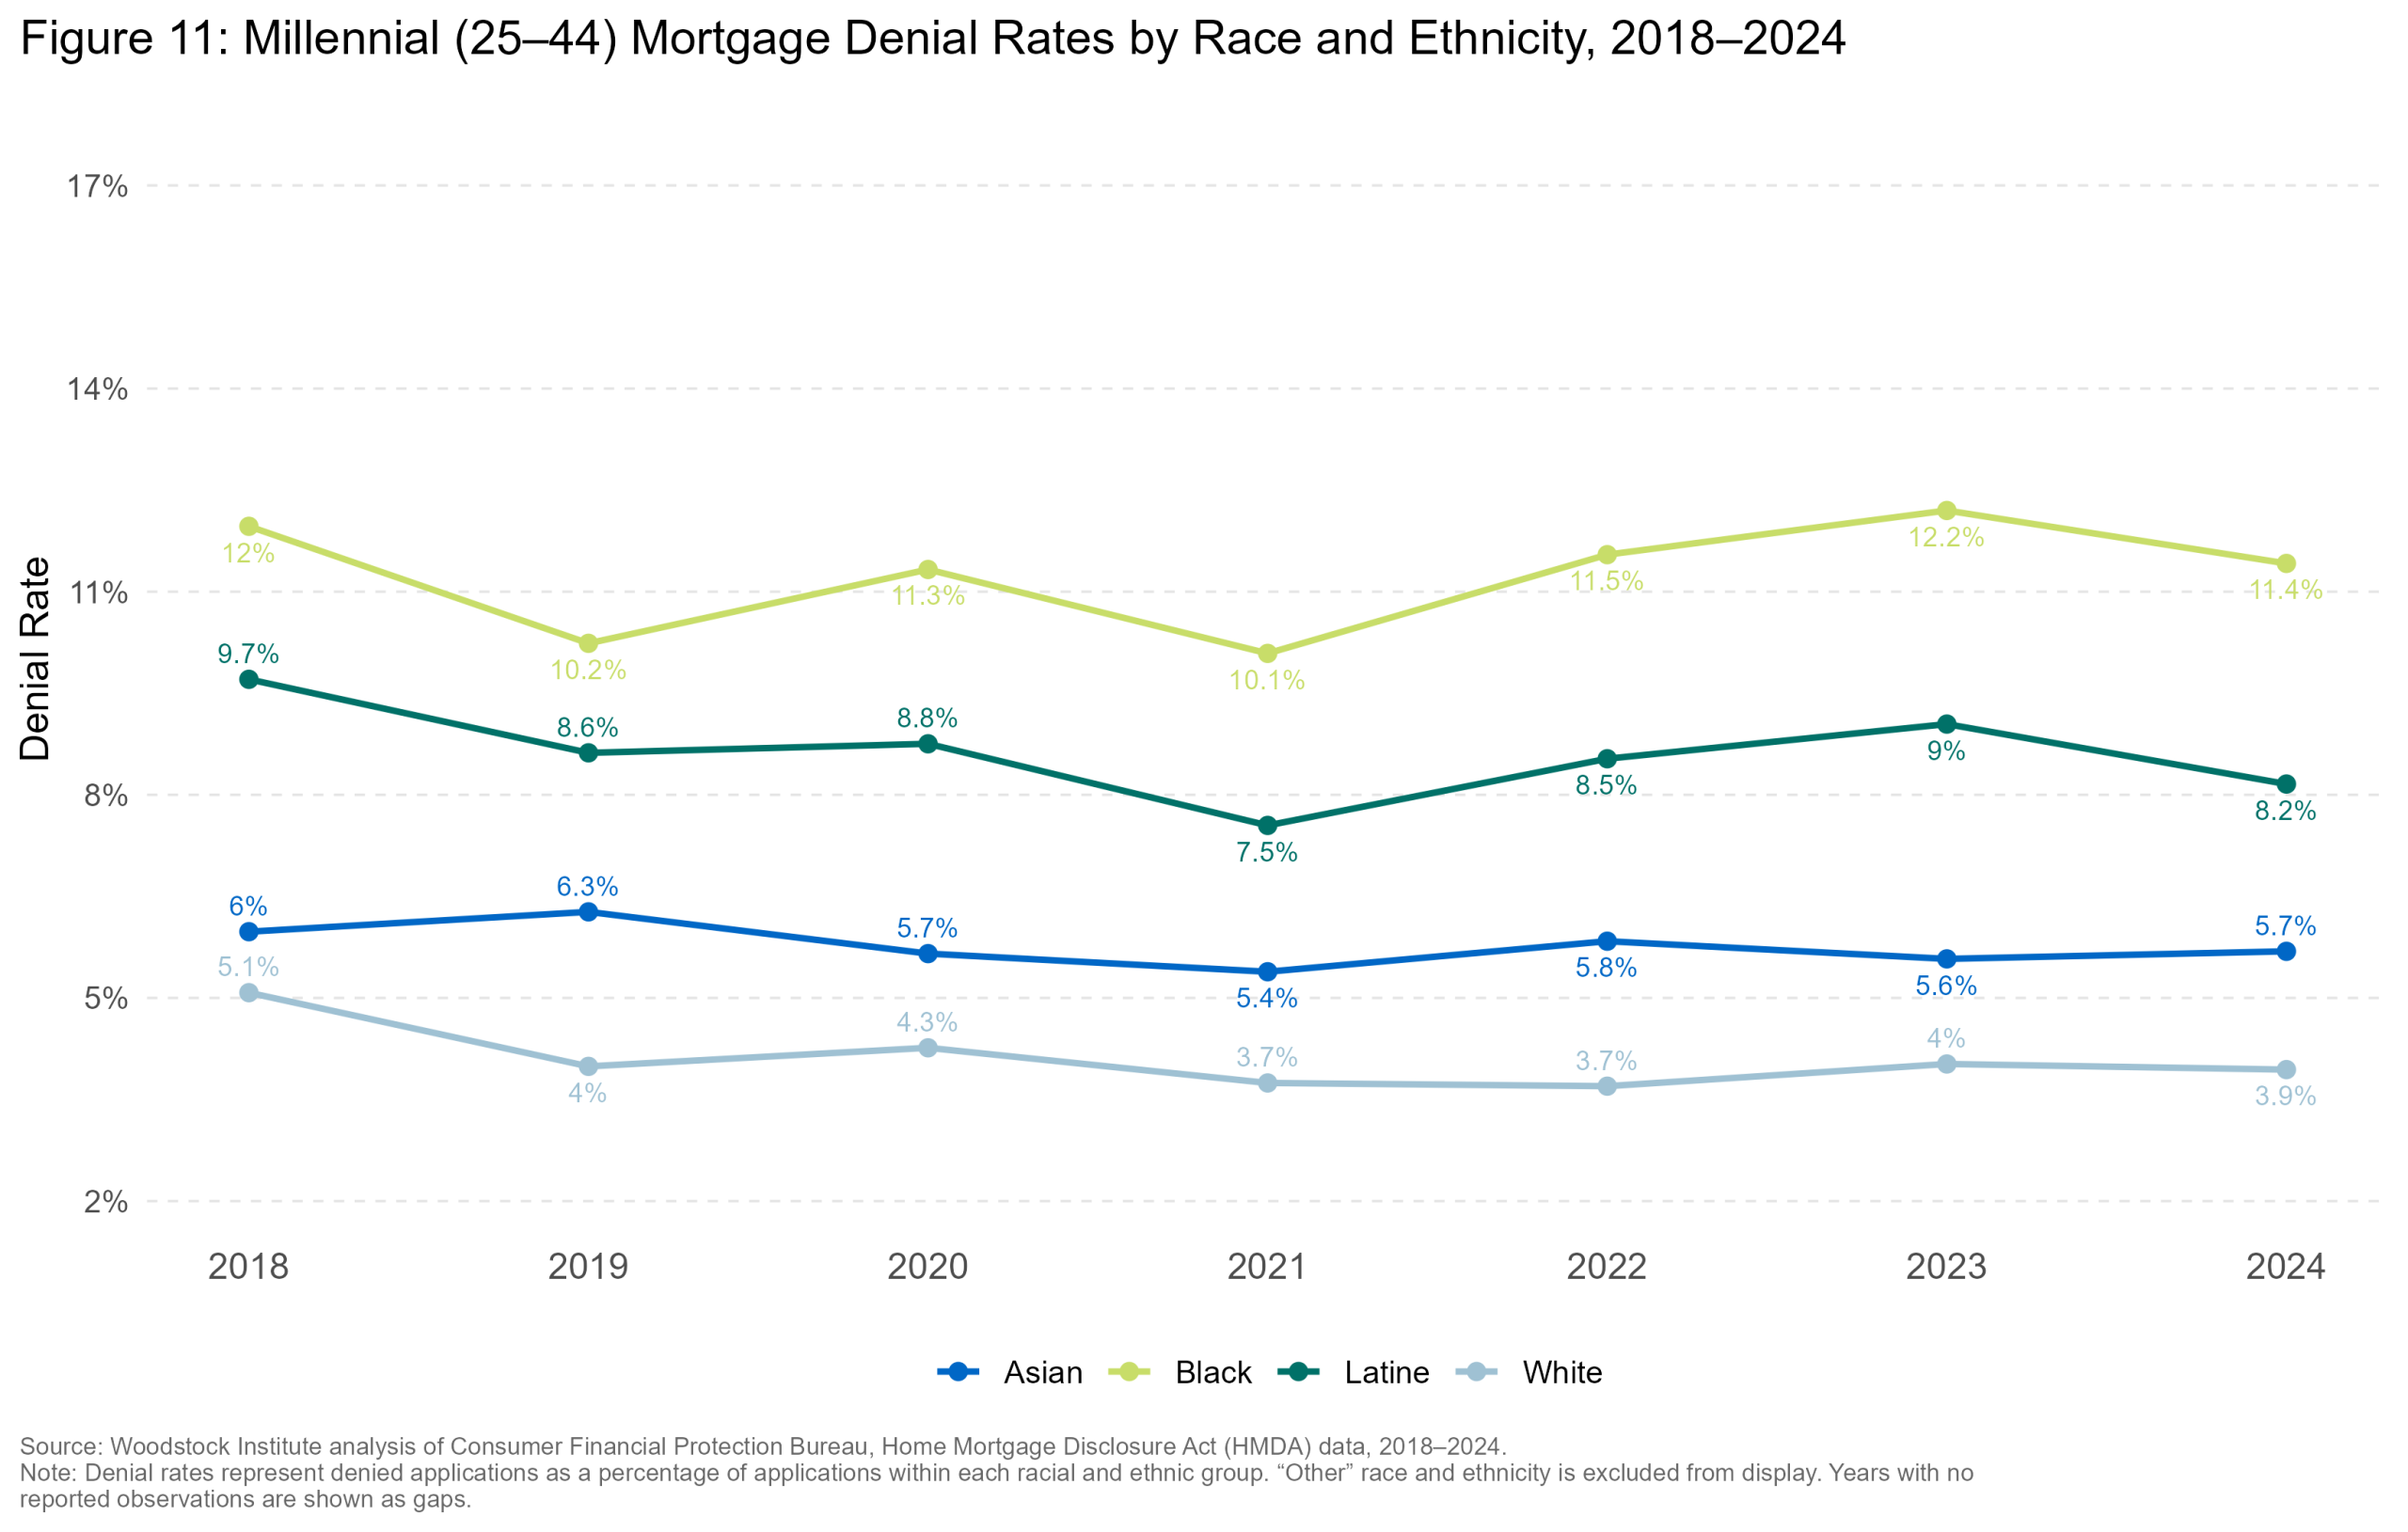
make_denial_chart_Six_Collar.png / .jpg / .jpegCheck the file exists in the graphs folder and that this HTML is opened from a browser with local file access enabled.
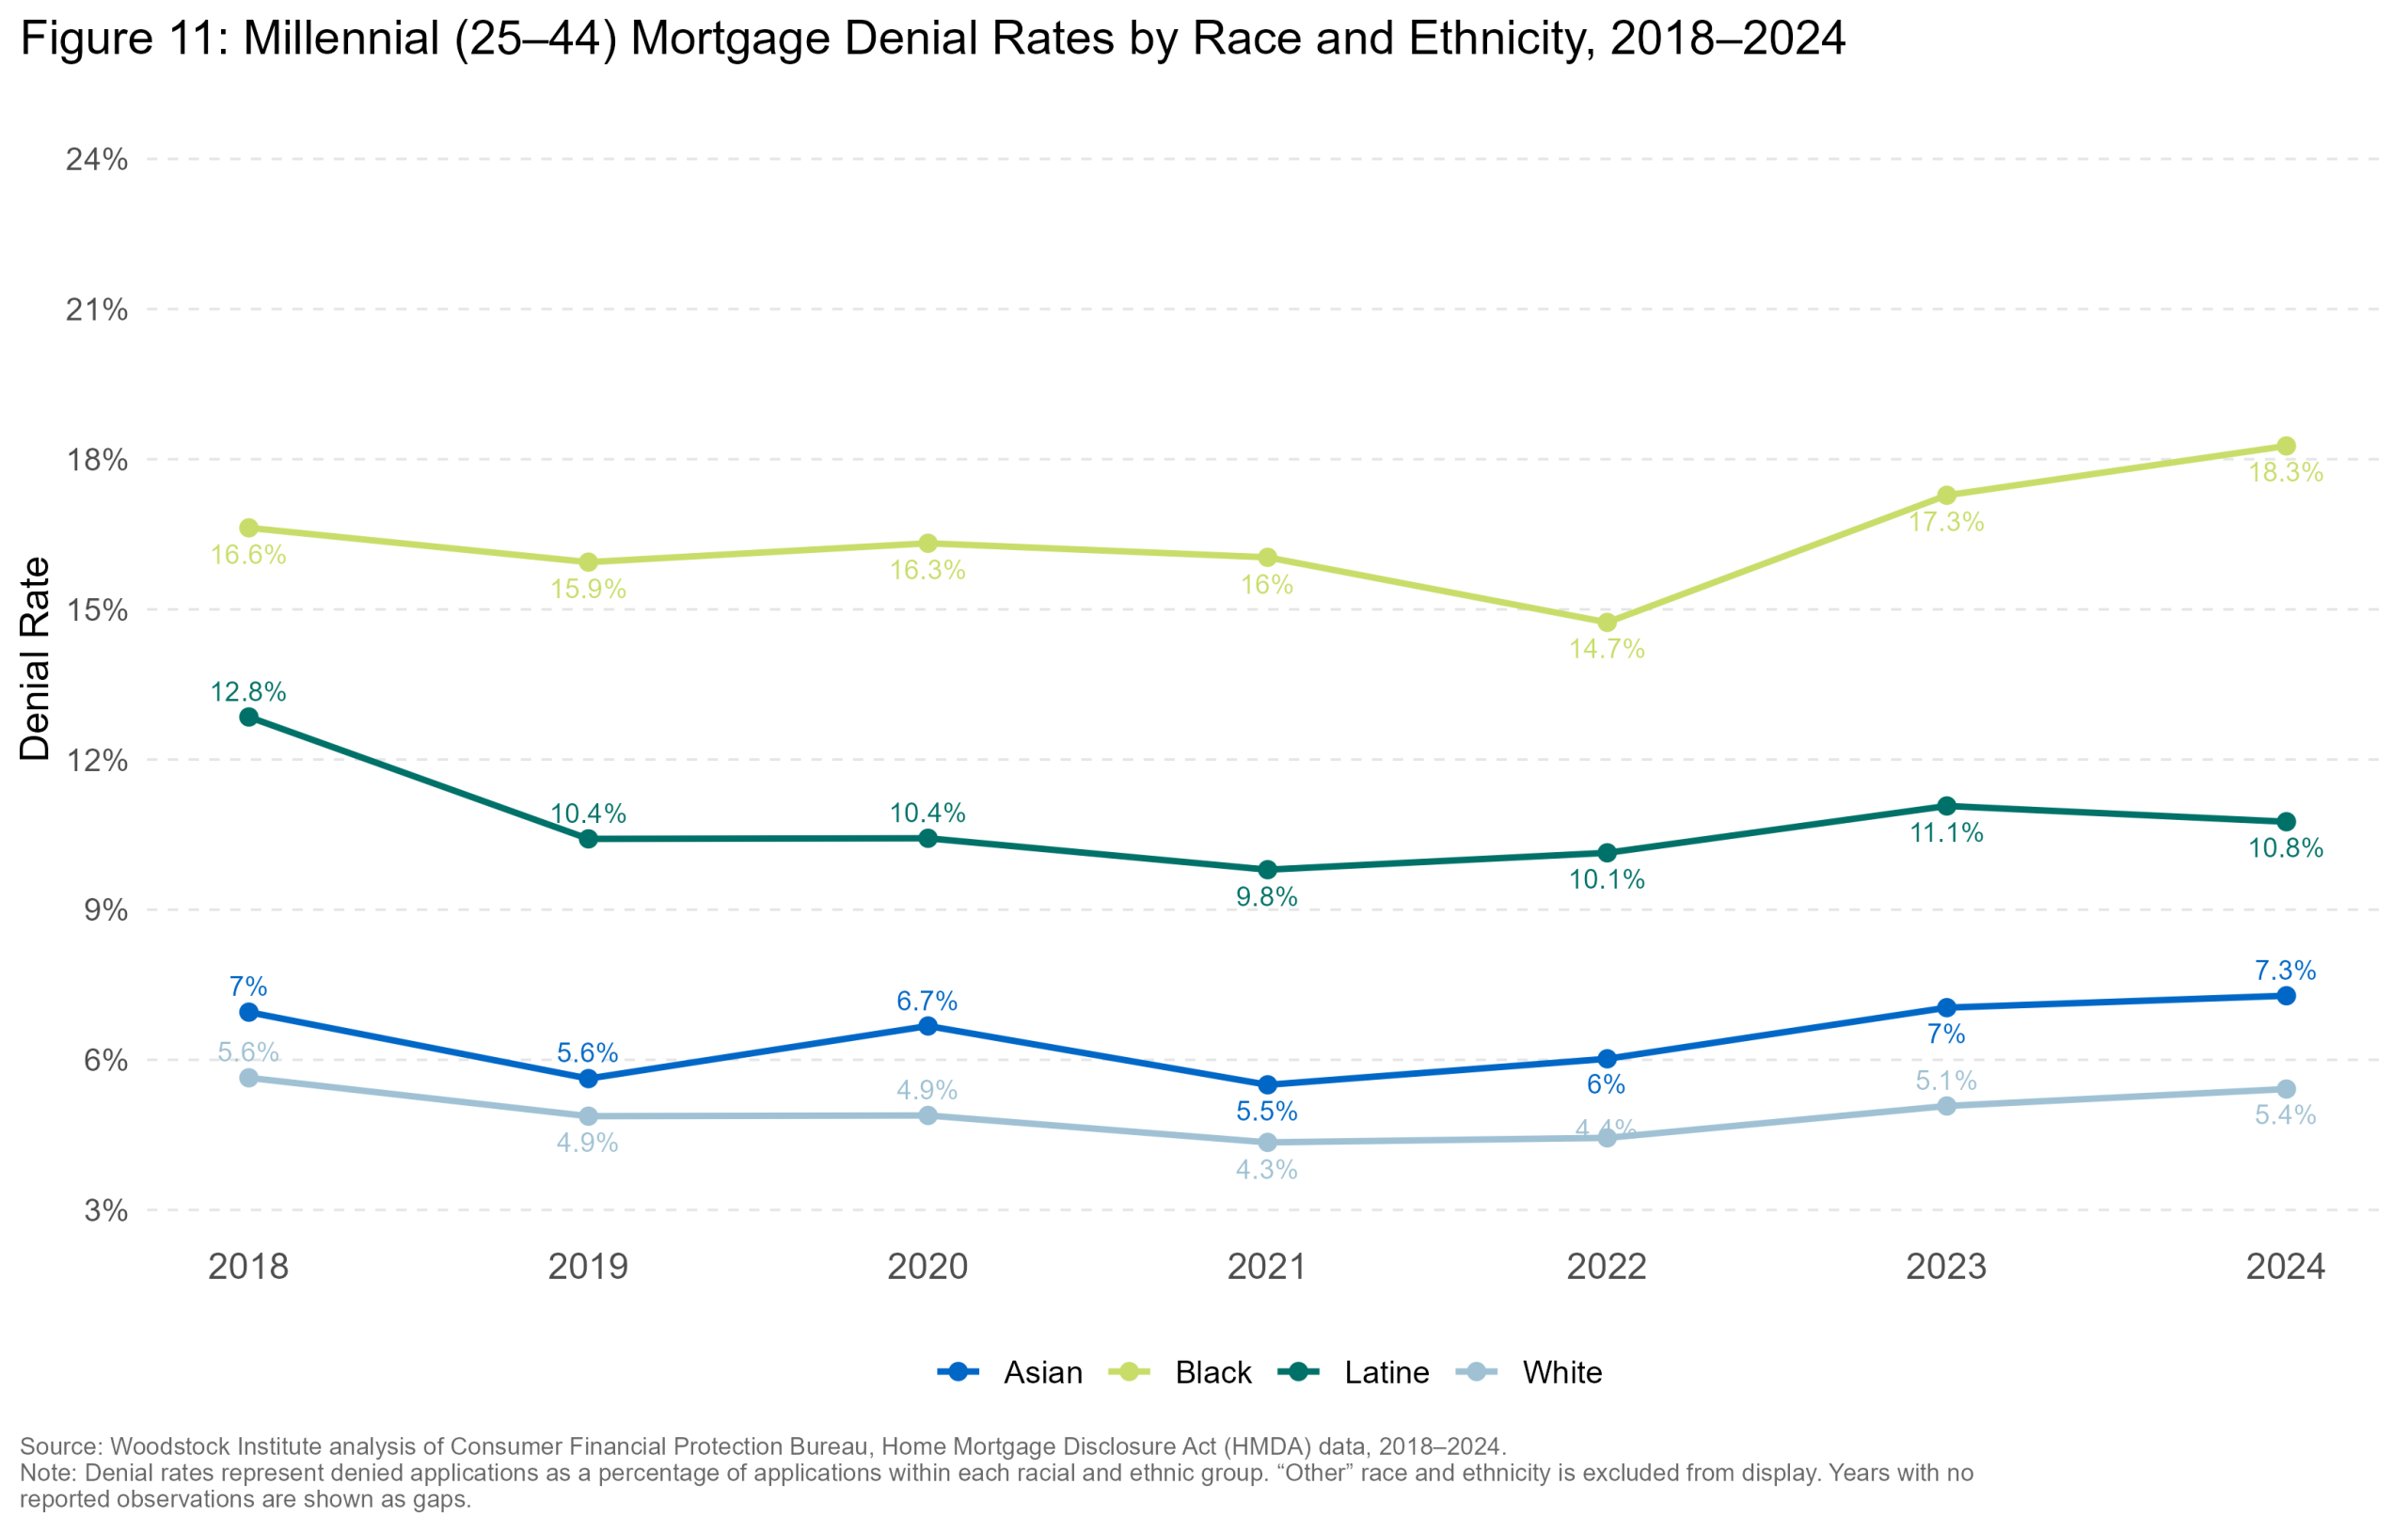
make_denial_chart_Suburban_Cook.png / .jpg / .jpegCheck the file exists in the graphs folder and that this HTML is opened from a browser with local file access enabled.
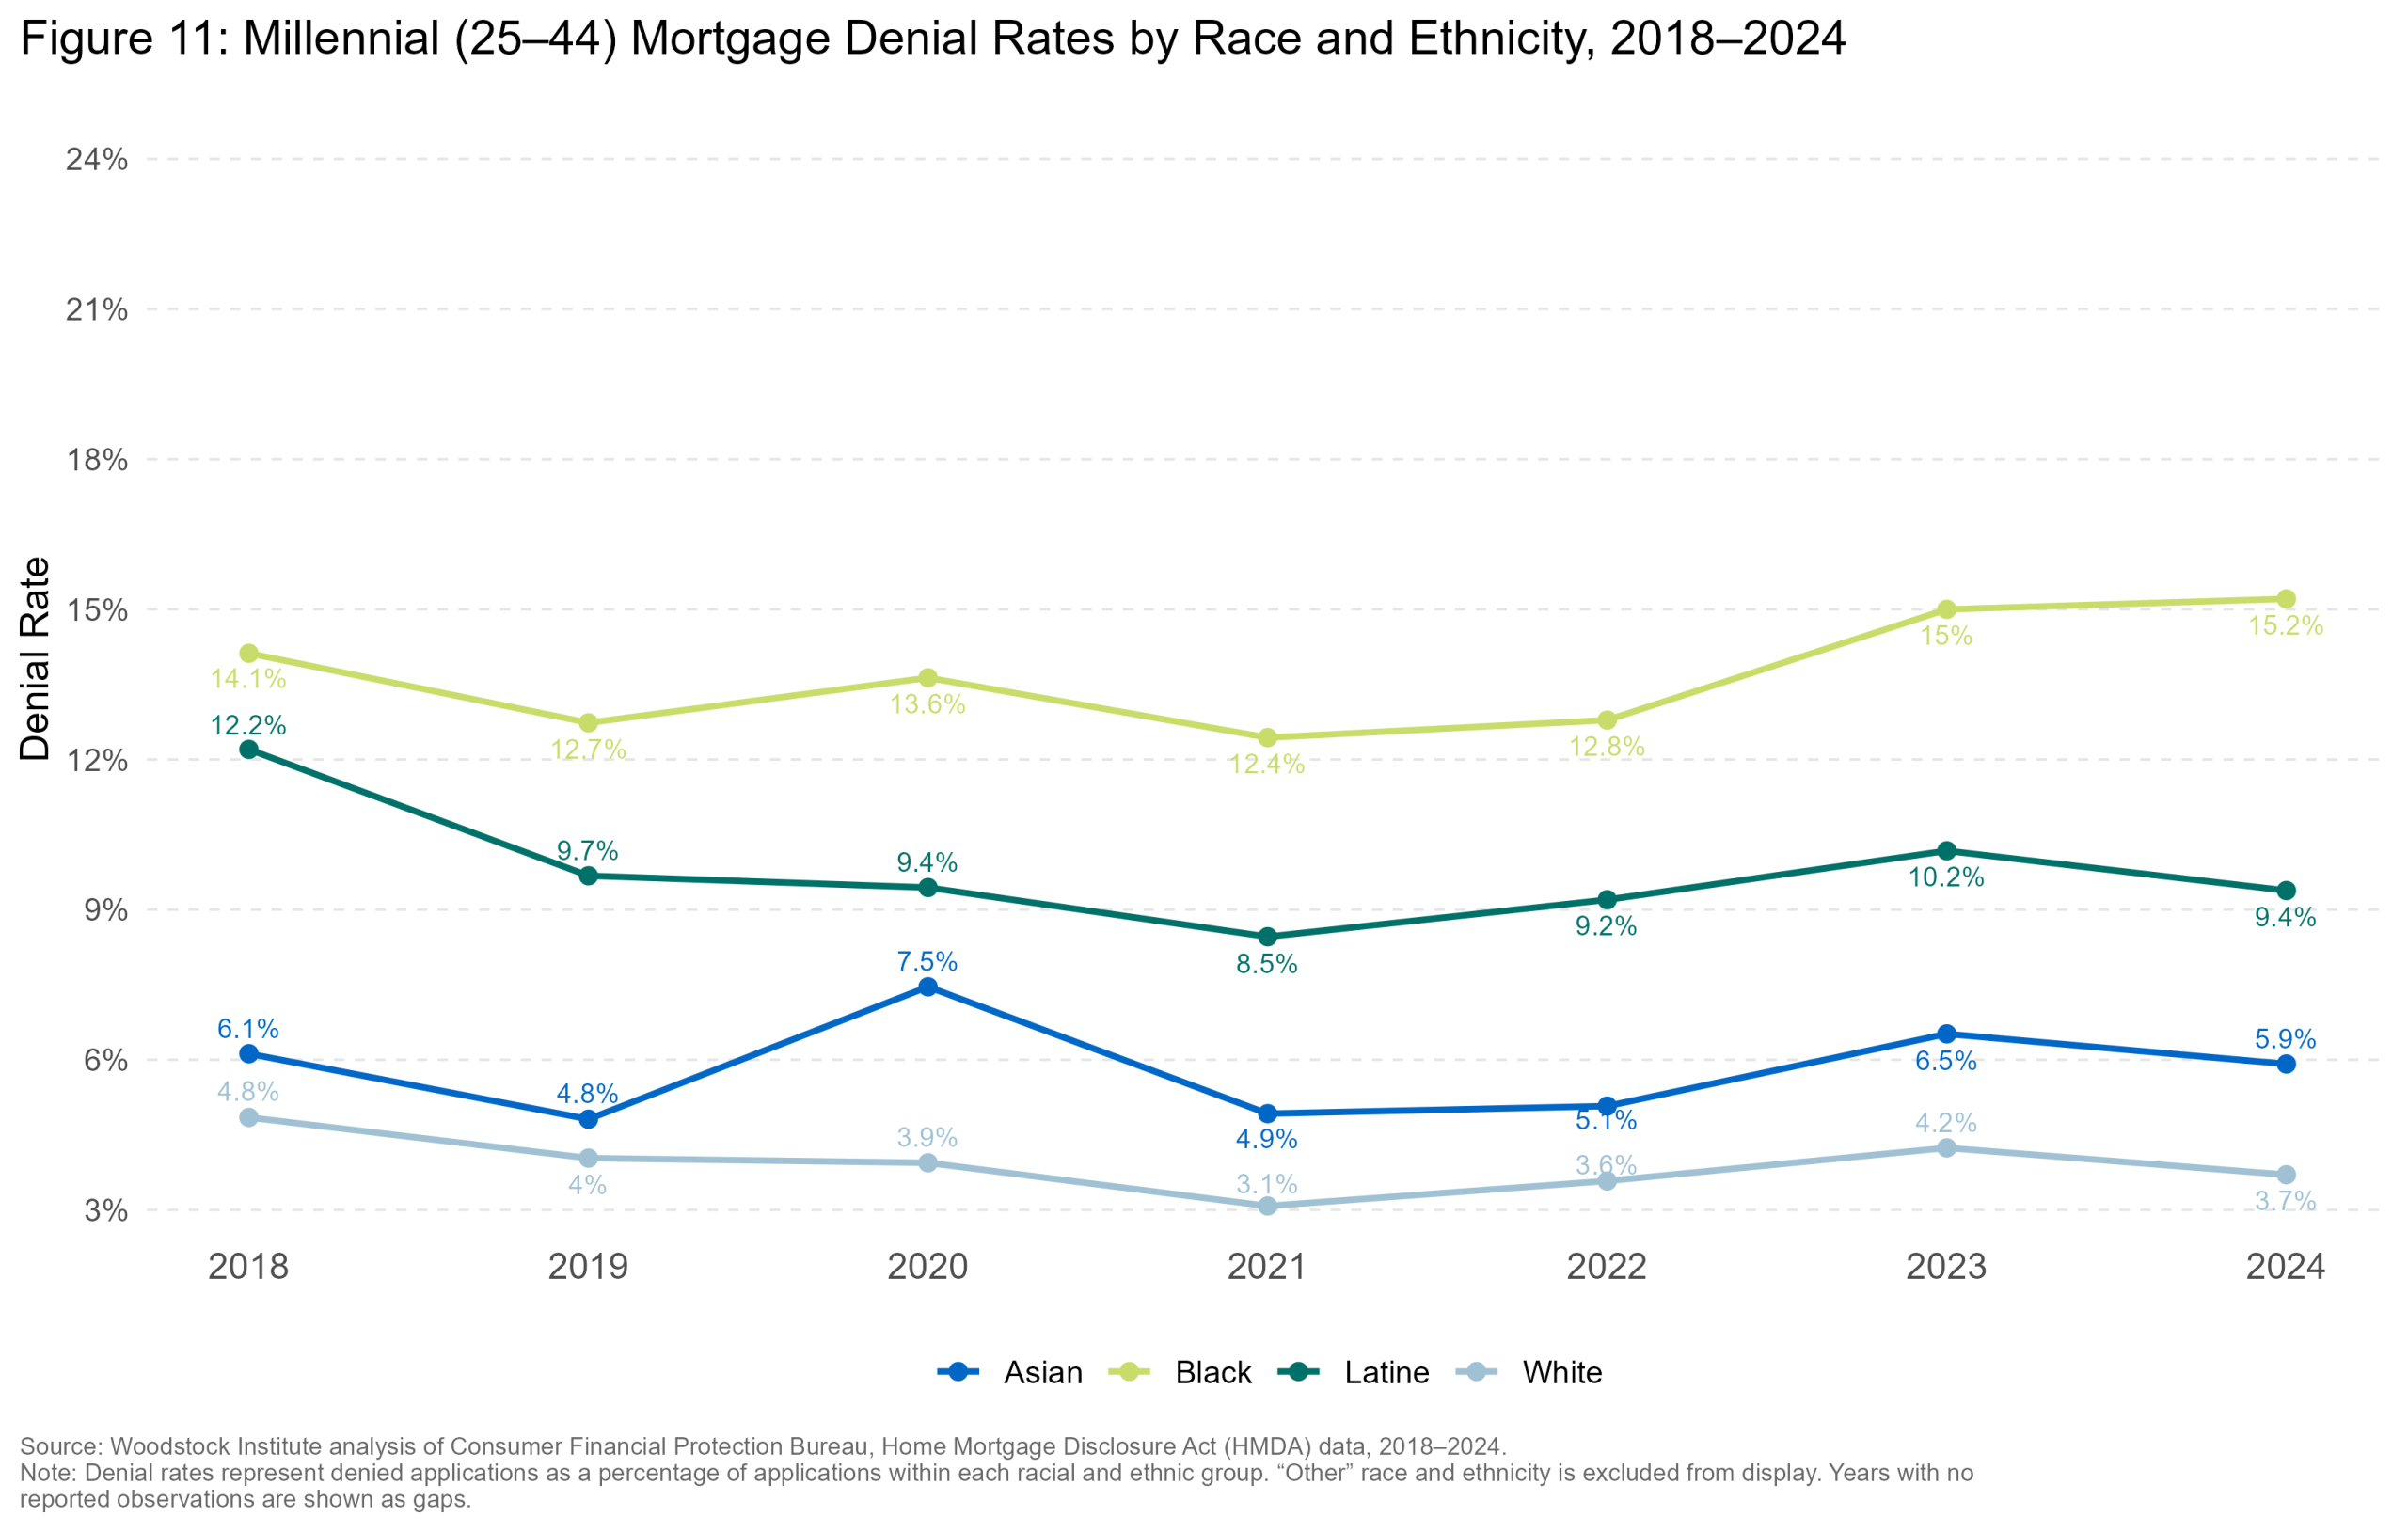
make_denial_chart_Chicago.png / .jpg / .jpegCheck the file exists in the graphs folder and that this HTML is opened from a browser with local file access enabled.
Denial reasons
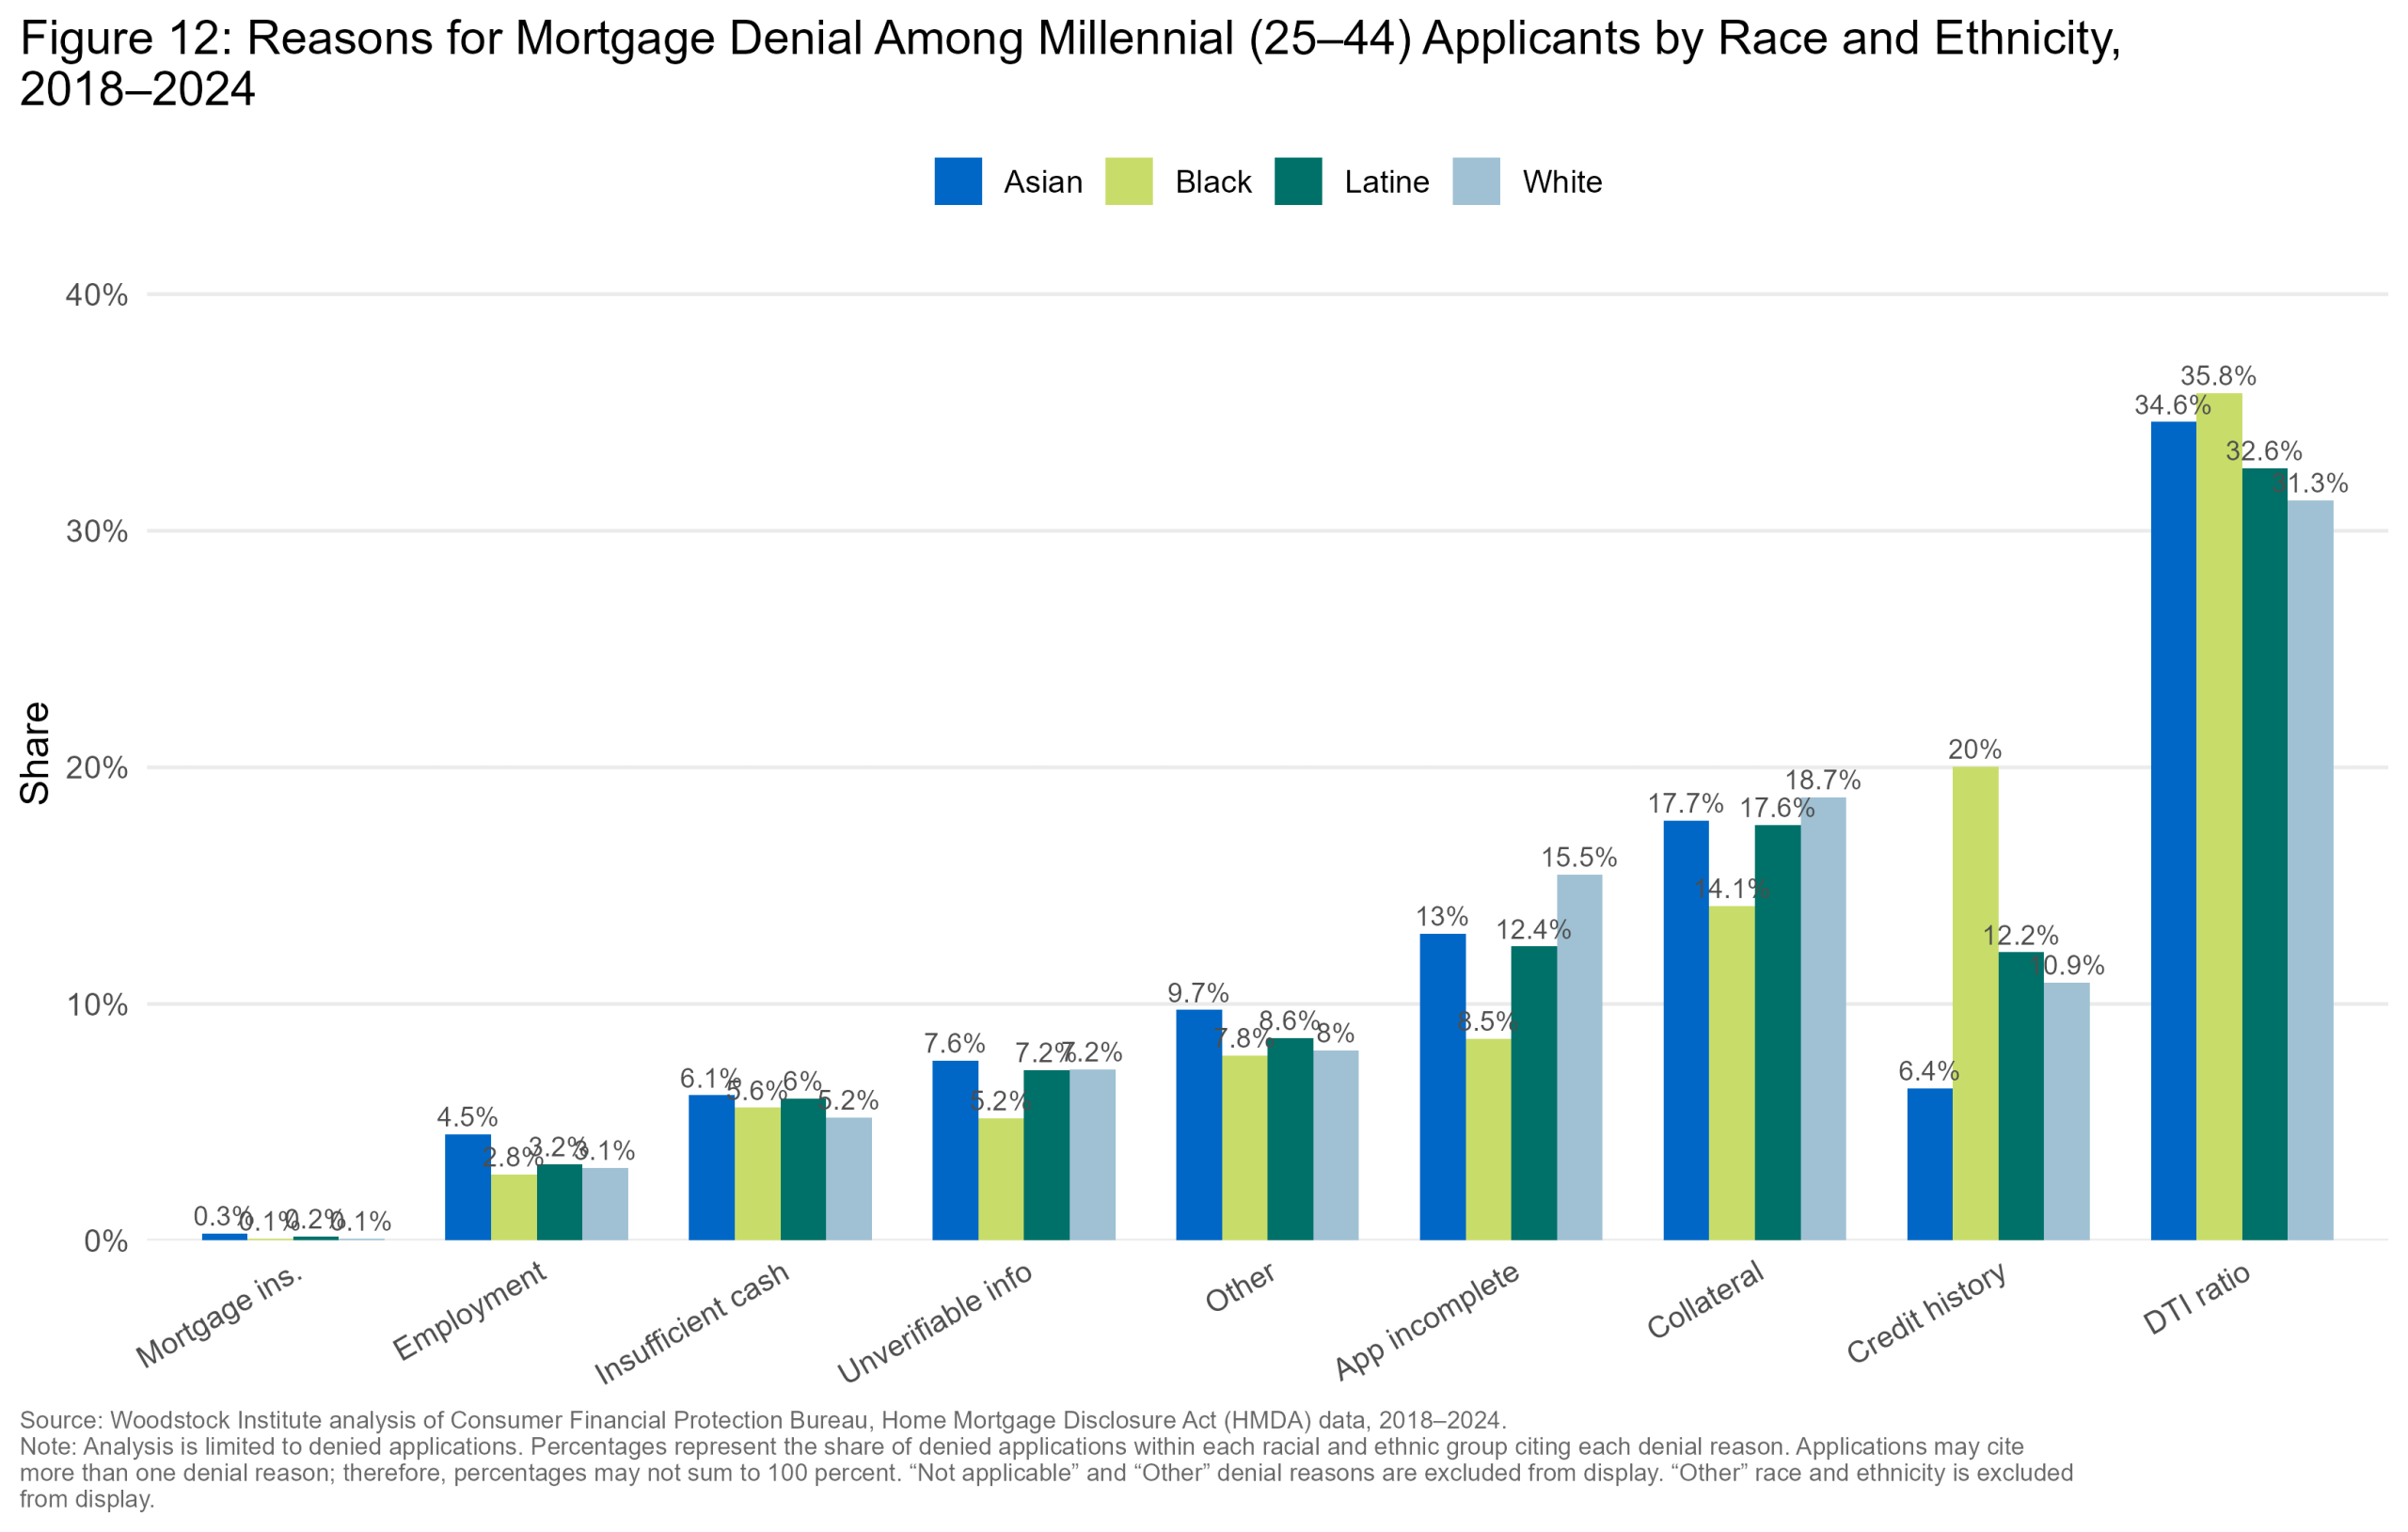
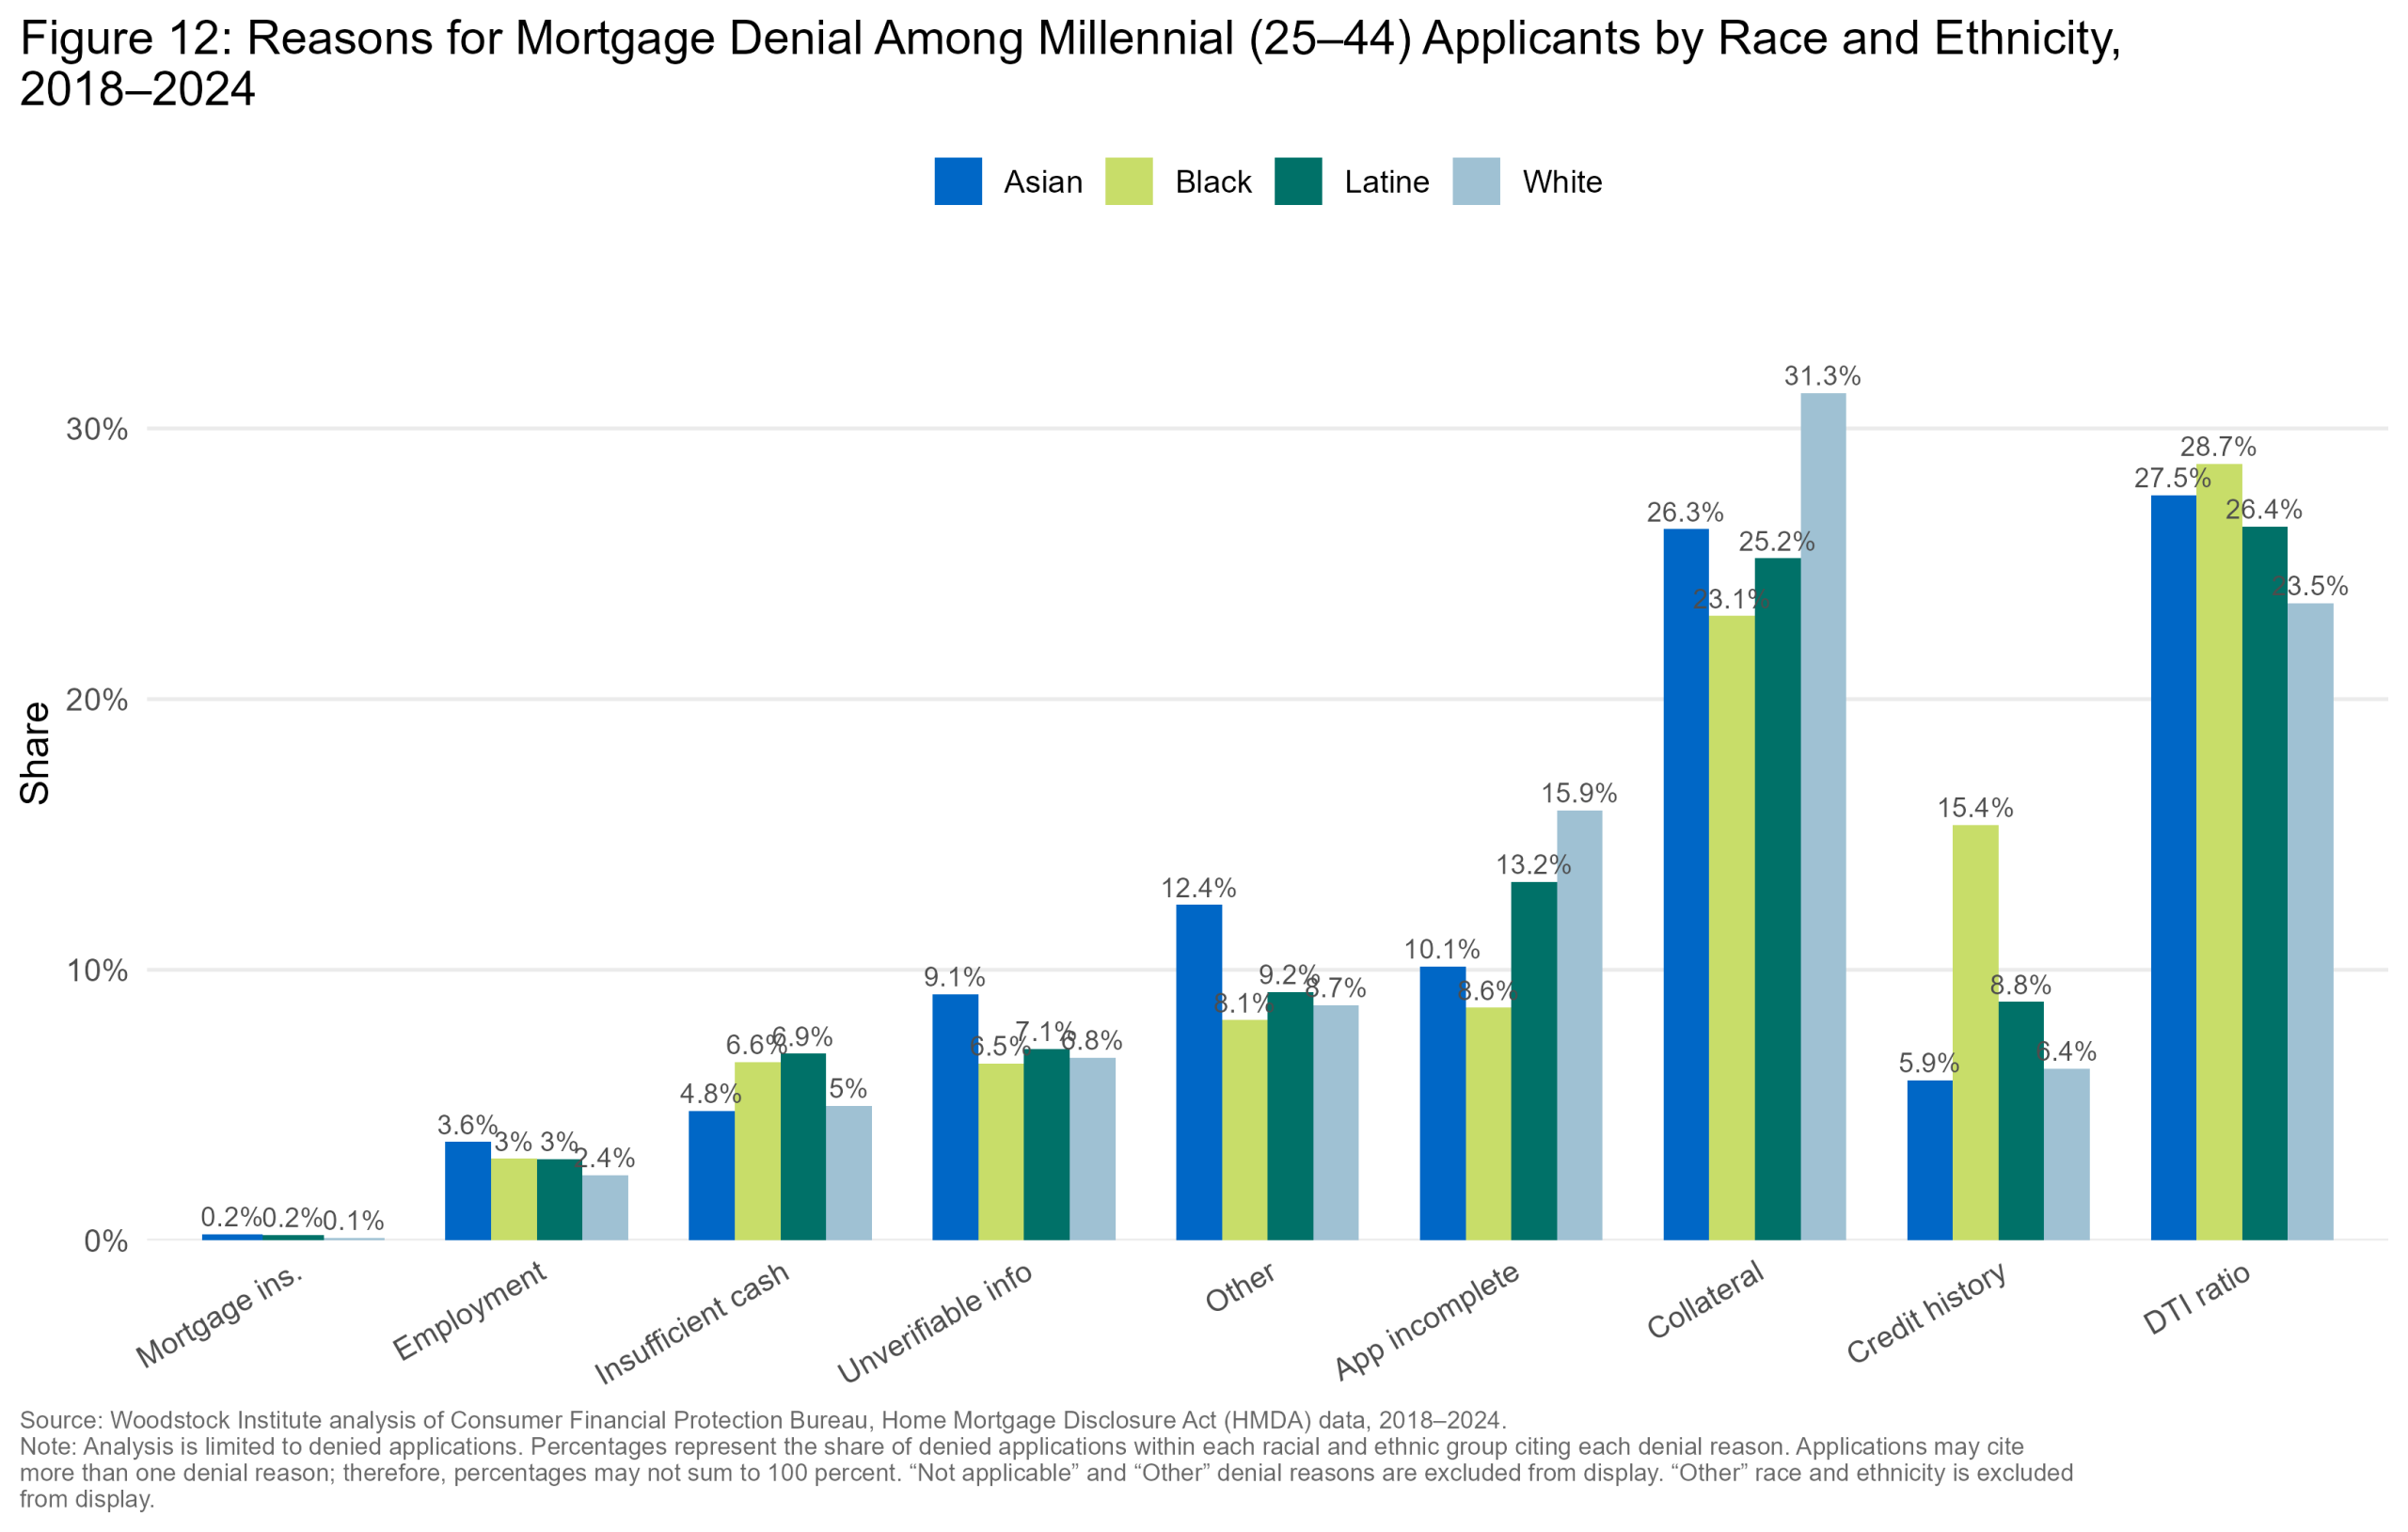
Denial reasons cited by lenders vary meaningfully by race among millennial applicants and provide insight into how lenders classify applicant risk. Only the first lender-cited denial reason is used in this analysis, and percentages are shares of each group’s denials. Statewide, debt-to-income ratio is the most cited denial reason for every racial group, but it accounts for a larger share of denials among Asian (33.7 percent), Black (33 percent), and Latine (31 percent) applicants than among White applicants (27.2 percent). Credit history shows the sharpest divide of any reason: it accounts for 22.2 percent of White and 20.6 percent of Black millennial denials, close to three times the share of Asian applicants (7.6 percent). Collateral, the third most cited denial reason, shows that Latine (17.8 percent), Asian (16.7 percent), White (16.7 percent), and Black (15.3 percent) applicants have comparable shares. (Figure 12)
Taken together, these patterns suggest that collateral accounts for a similar share of every group’s denial, while credit history accounts for a much larger share of Black and White denials than of Asian denials. Debt-to-income ratio is the leading reason for every group and accounts for a larger share of denials among Asian, Black, and Latine applicants than among White applicants. The prominence of DTI as a denial reason is consistent with earlier findings that Black and Latine applicants are more concentrated in higher DTI brackets.
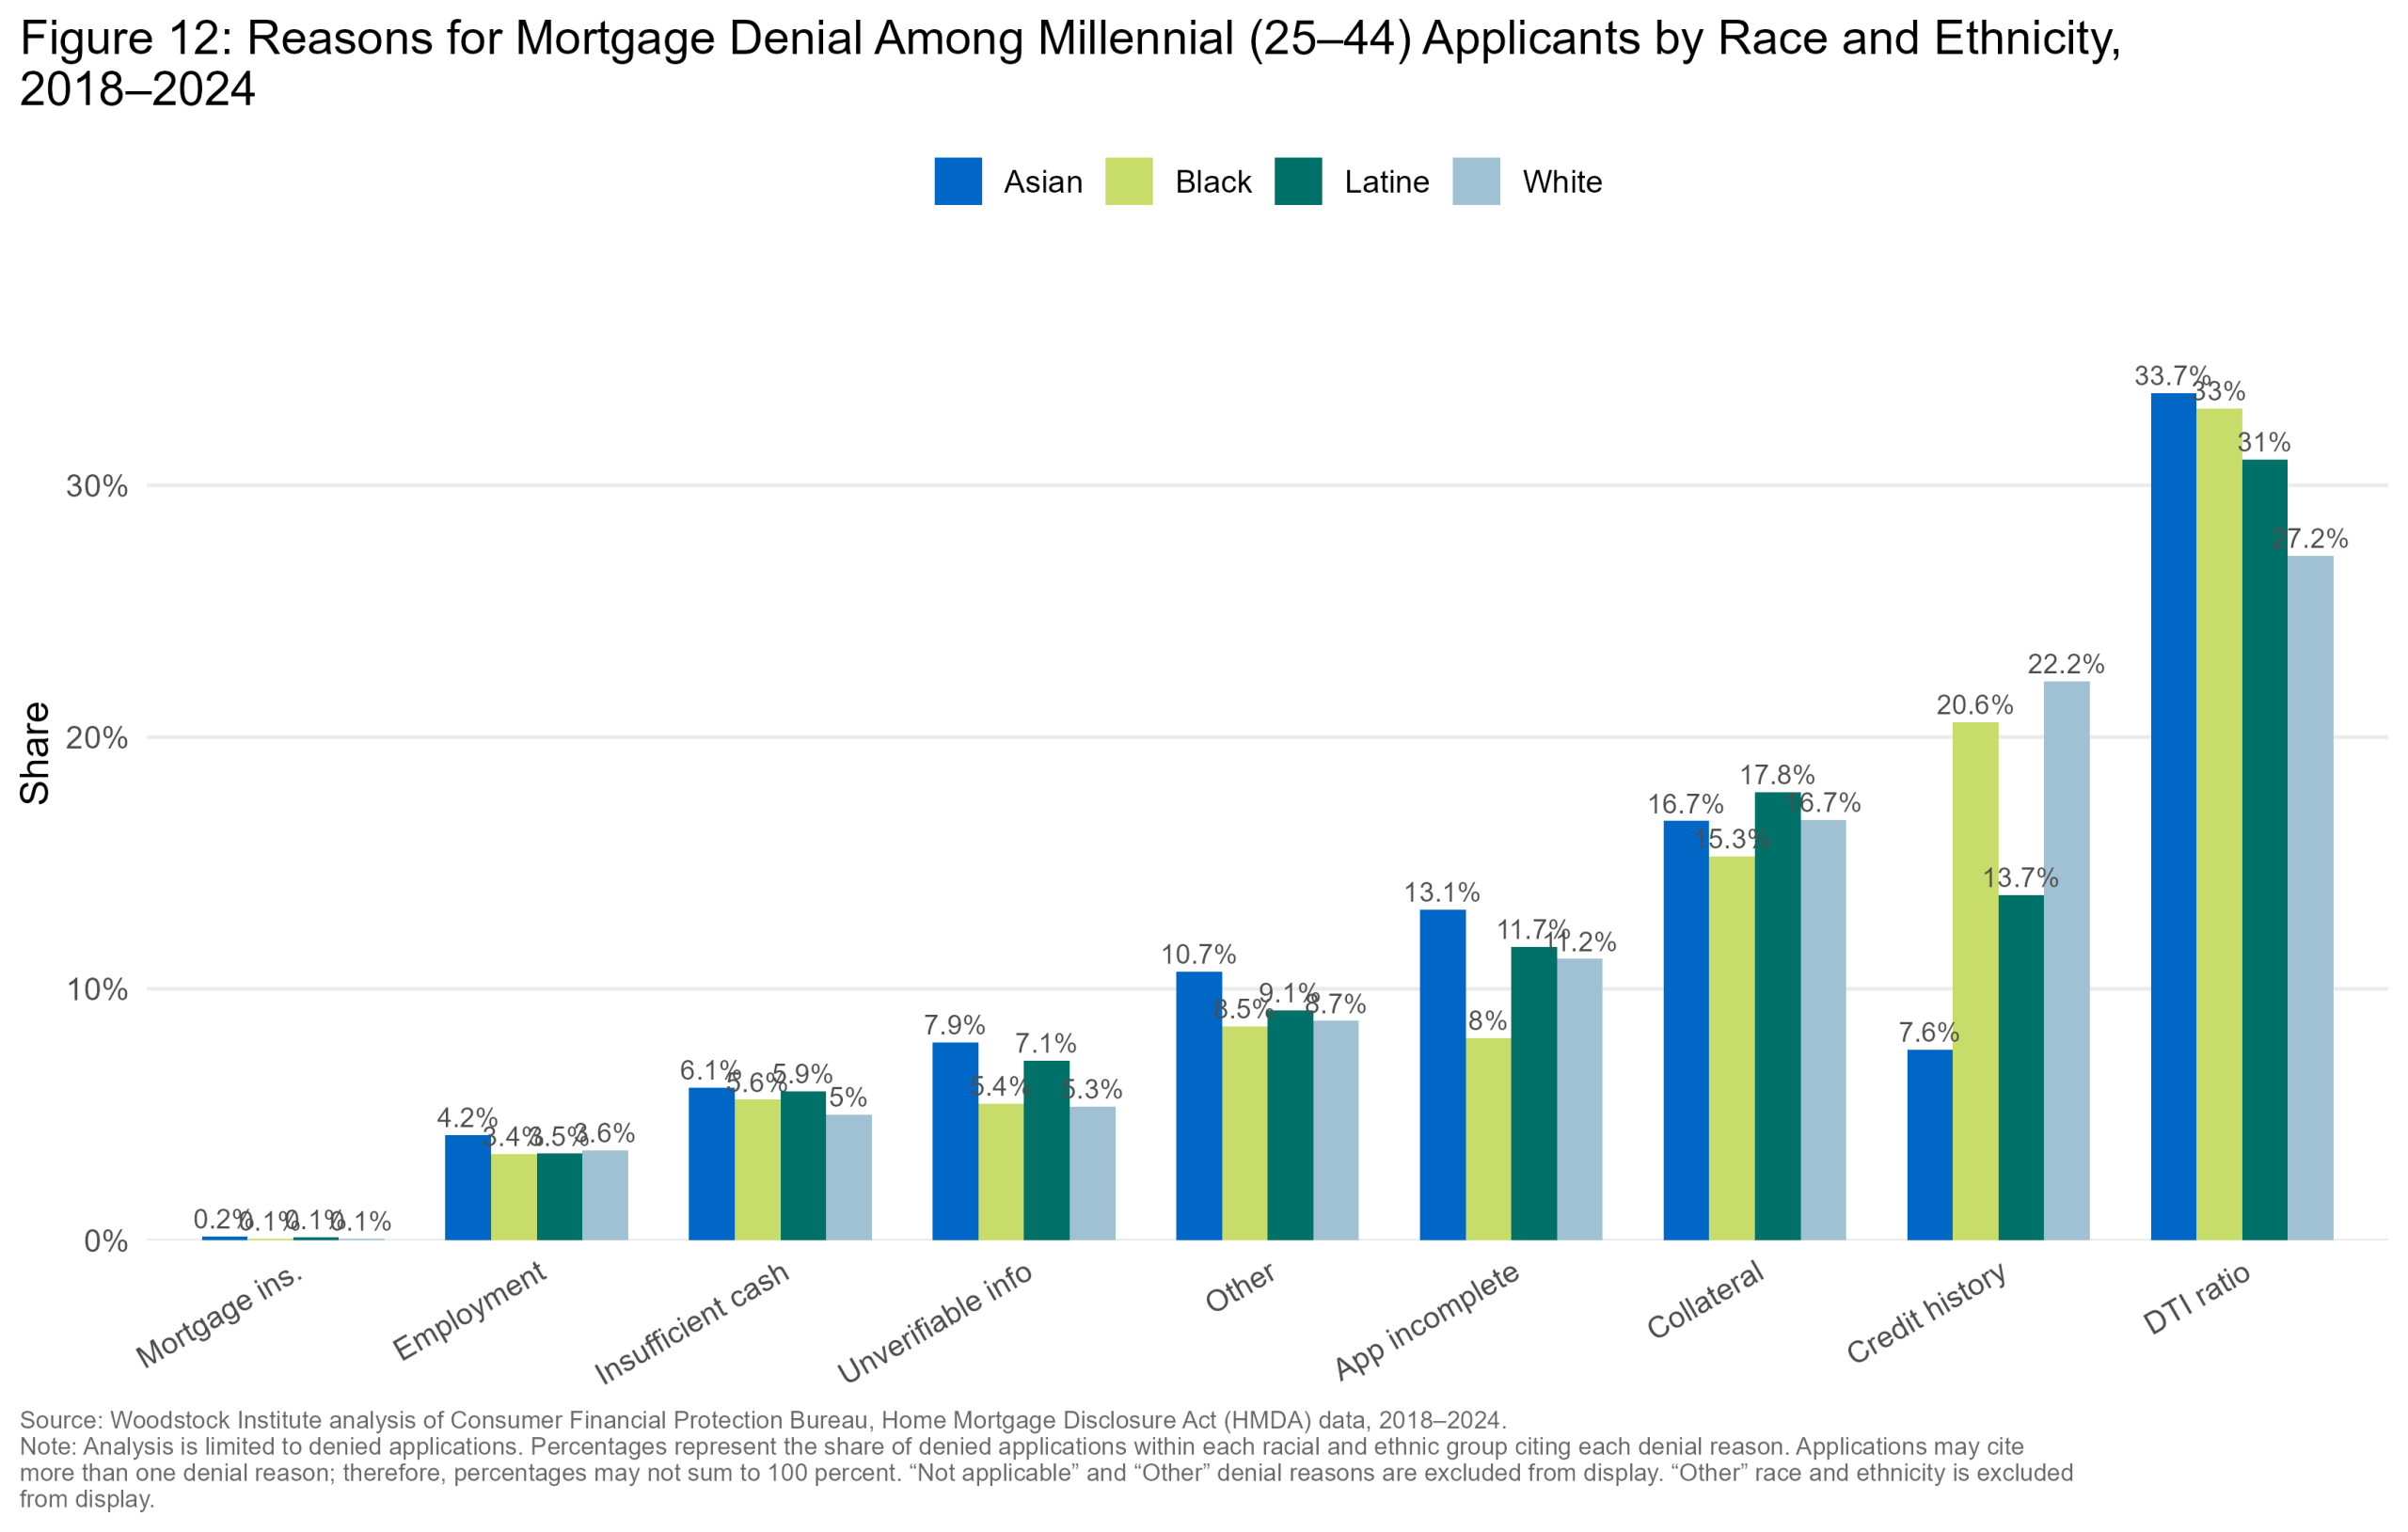
mill_denial_reasons_by_race_pct_Illinois.png / .jpg / .jpegCheck the file exists in the graphs folder and that this HTML is opened from a browser with local file access enabled.
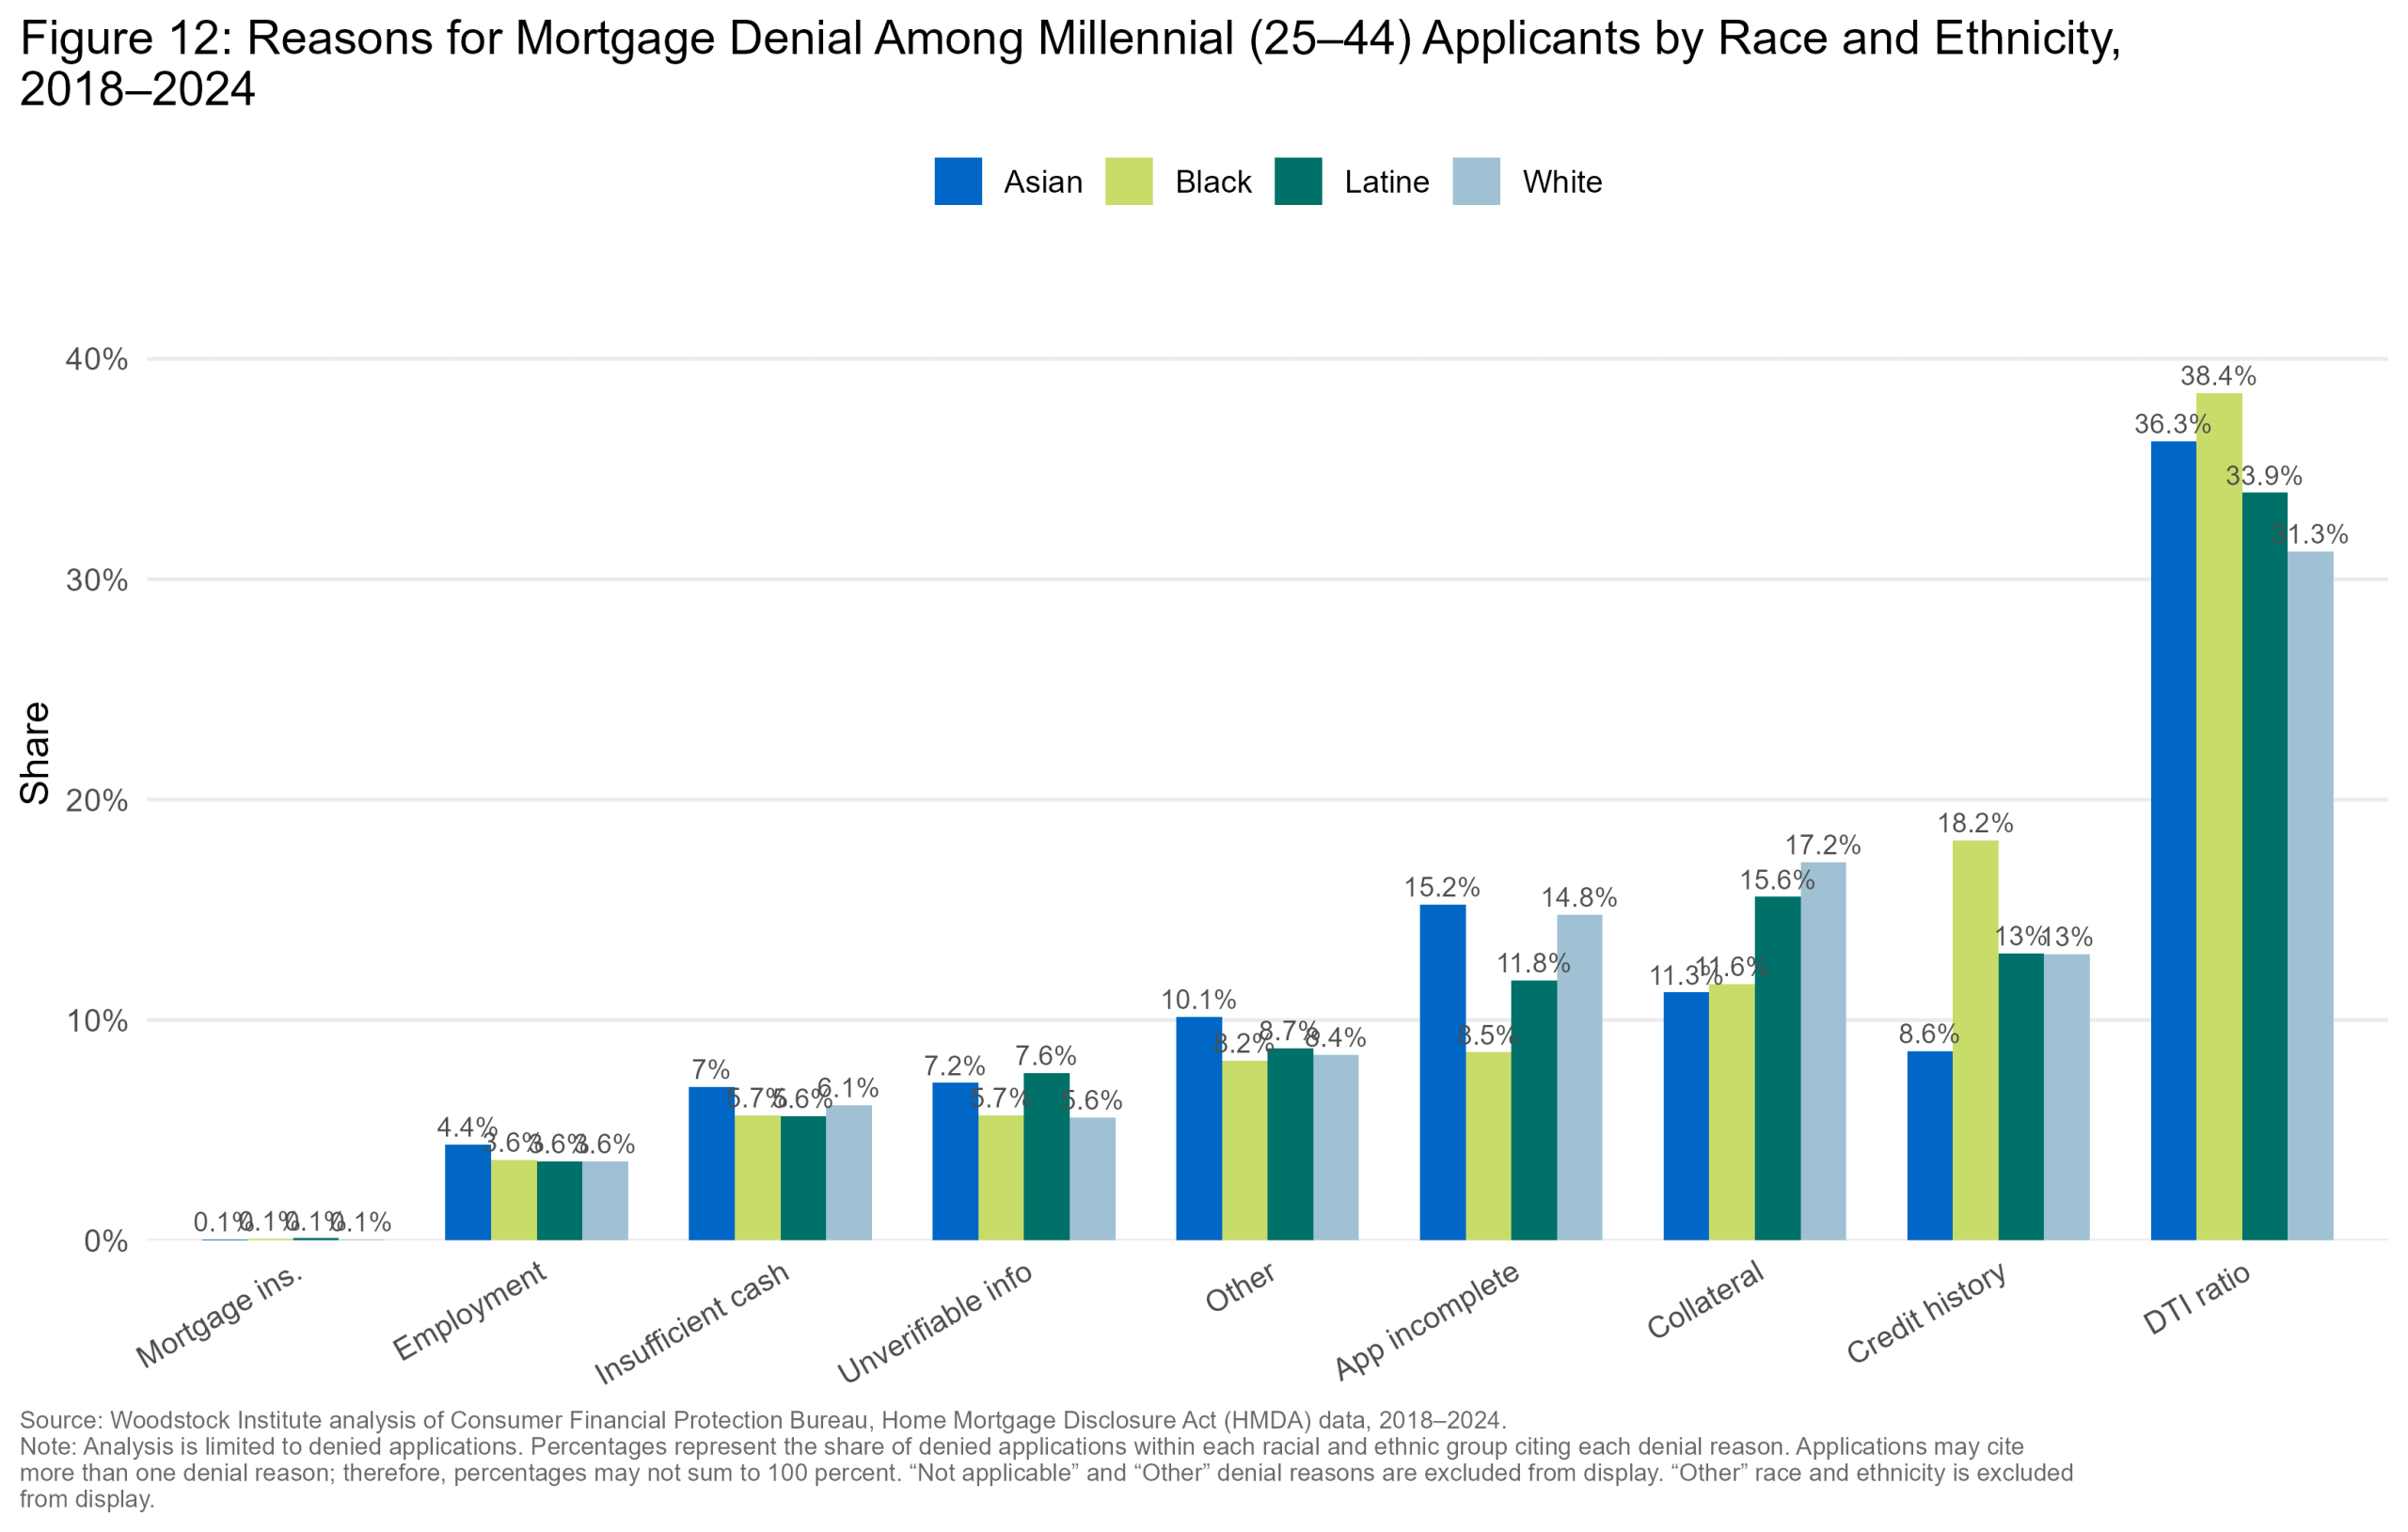
mill_denial_reasons_by_race_pct_Six_Collar.png / .jpg / .jpegCheck the file exists in the graphs folder and that this HTML is opened from a browser with local file access enabled.
mill_denial_reasons_by_race_pct_Suburban_Cook.png / .jpg / .jpegCheck the file exists in the graphs folder and that this HTML is opened from a browser with local file access enabled.
mill_denial_reasons_by_race_pct_Chicago.png / .jpg / .jpegCheck the file exists in the graphs folder and that this HTML is opened from a browser with local file access enabled.
In the six collar counties, debt-to-income ratio remains the top denial reason for every group, credit history accounts for 18.2 percent of Black denials, more than double the 8.6 percent share among Asian applicants, a similar pattern seen statewide. In suburban Cook County, the credit history gap is even wider. Credit history accounts for 20 percent of Black millennial denials, more than three times the 6.4 percent share among Asian applicants. Chicago shows the most distinct pattern of any geography. Debt-to-income and collateral are the two leading reasons for every group, together account for more than half of denials. Collateral accounts for 23 to 31 percent of denials across groups and is the leading reason for White applicants (31.3 percent). Collateral denials may also reflect more than an individual borrower’s qualifications and may be connected to the age, condition, valuation, and location of the properties available within a borrower’s price range. Debt-to-income ratio accounts for roughly a quarter of denials in Chicago and is the leading reason for Black (28.7 percent), Asian (27.5 percent), and Latine (26.4 percent) millennial applicants. (Figure 12)
Applications and originations, by gender
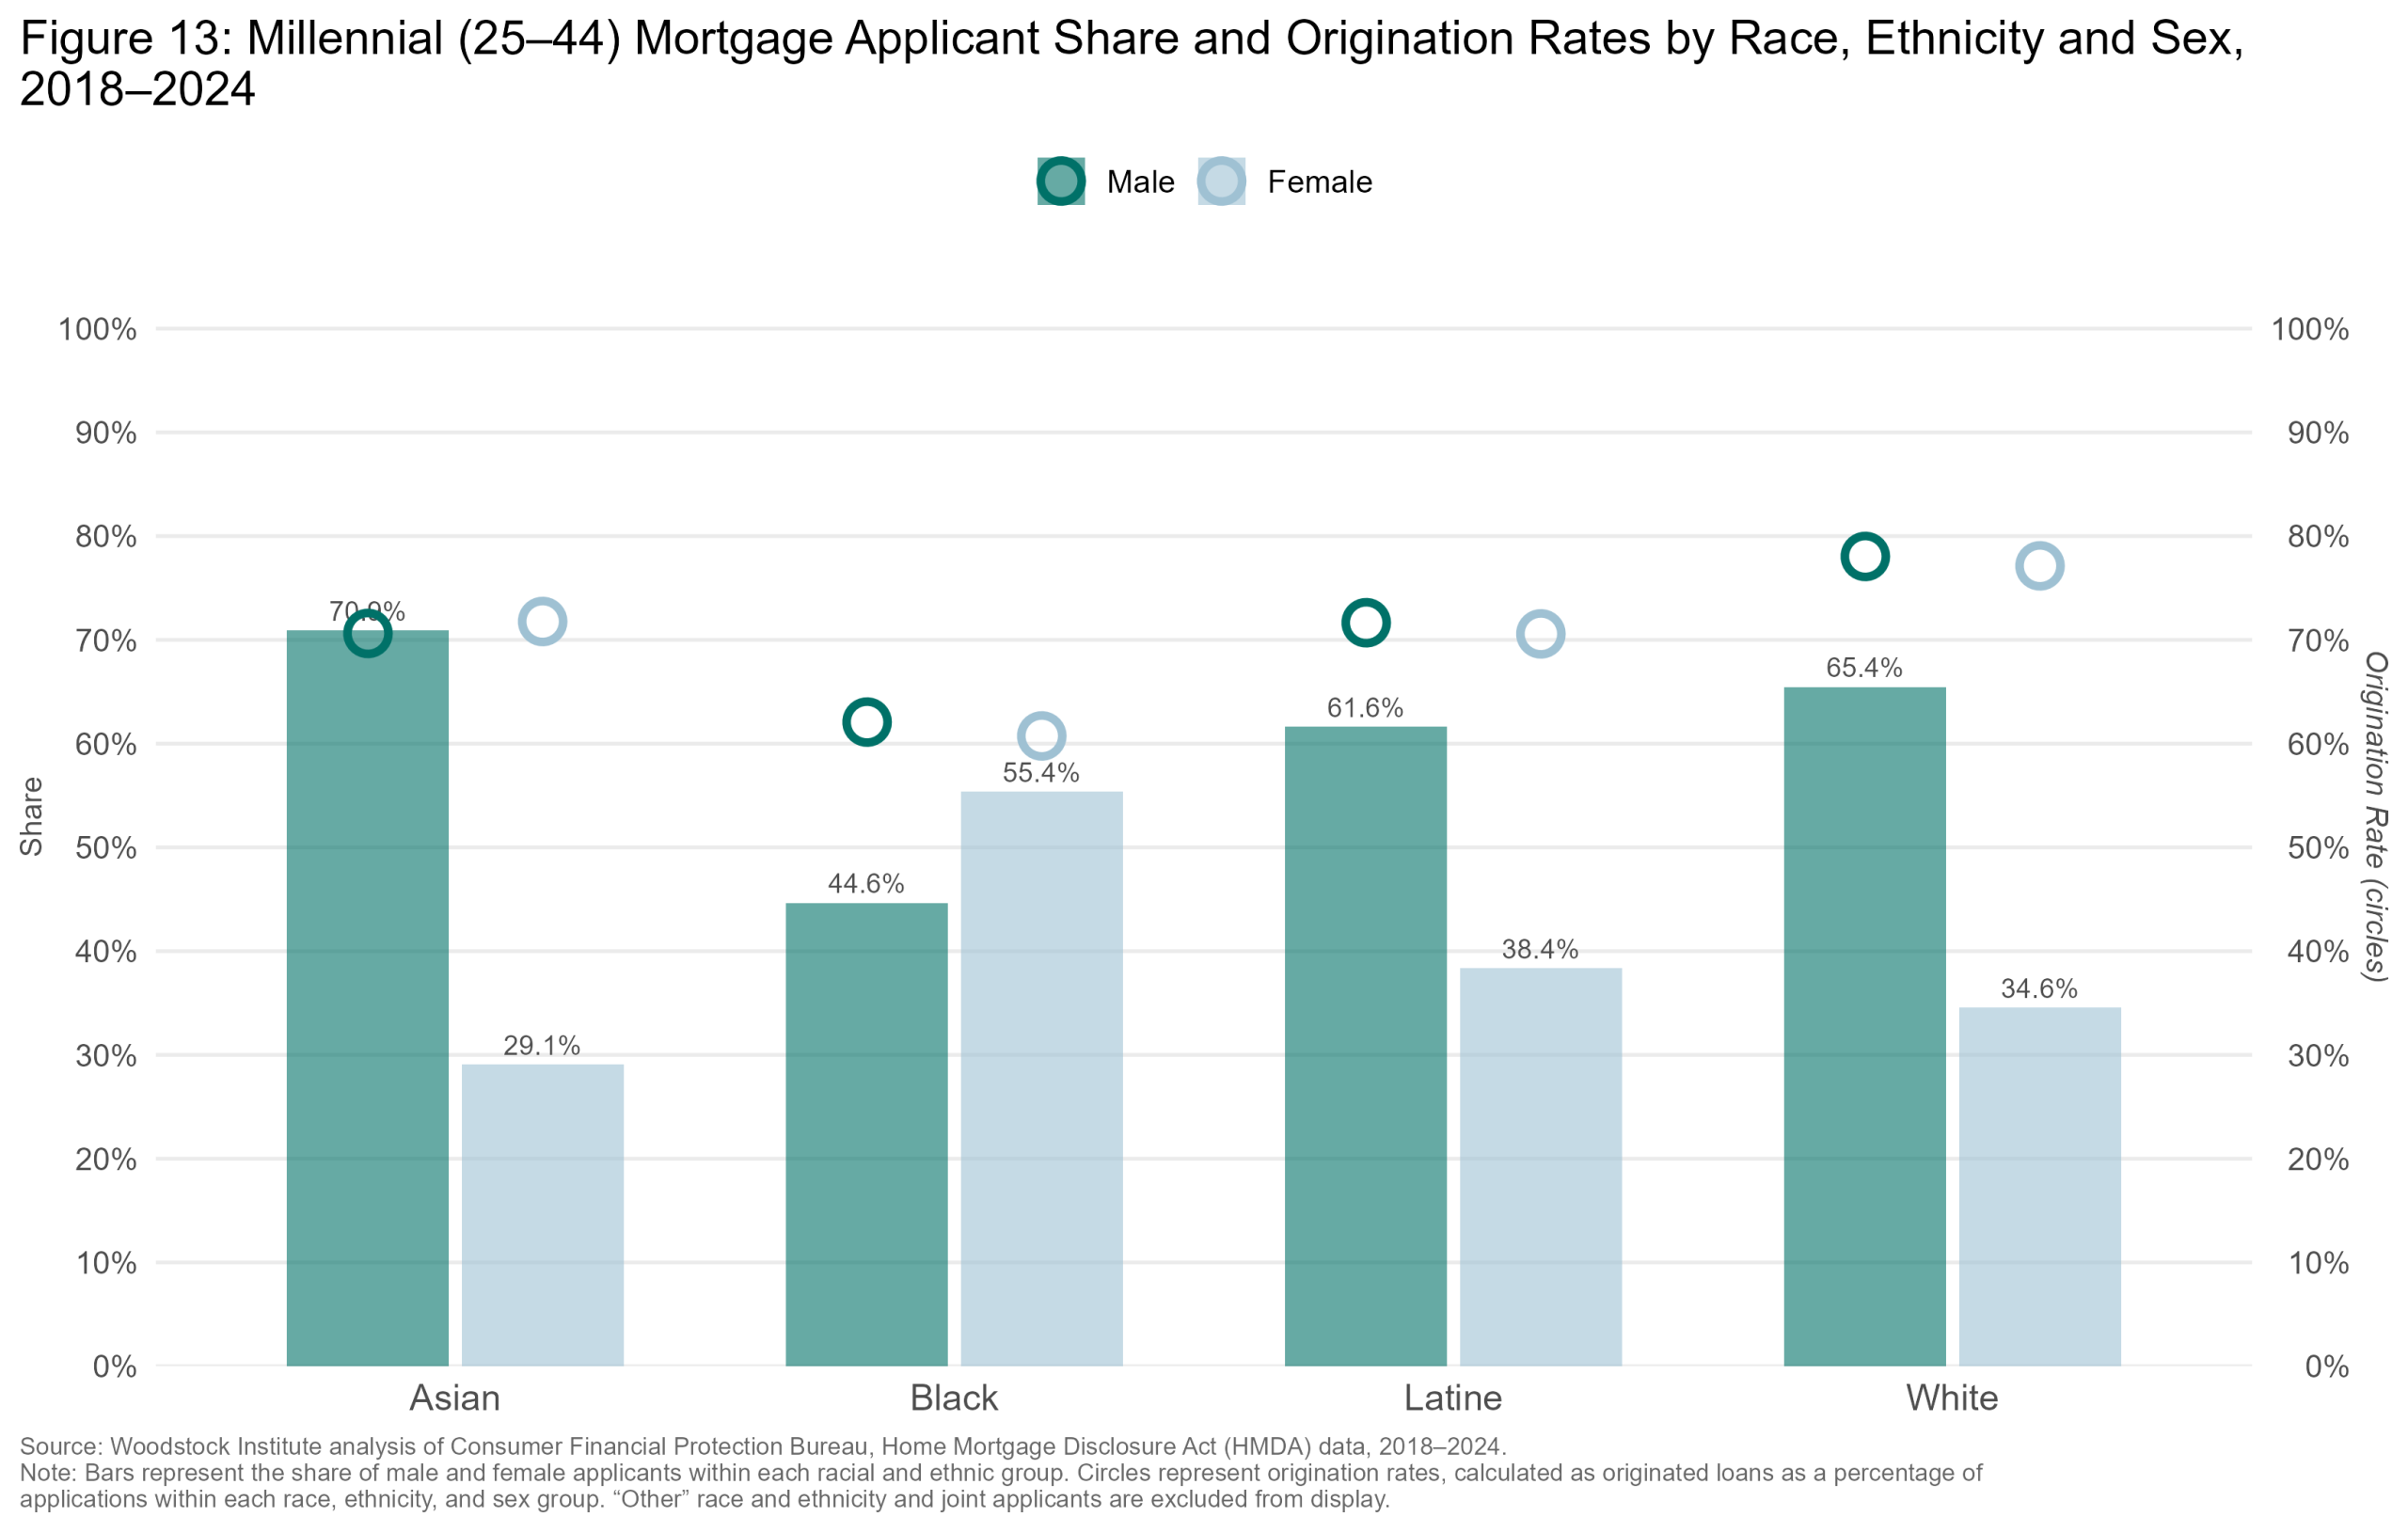
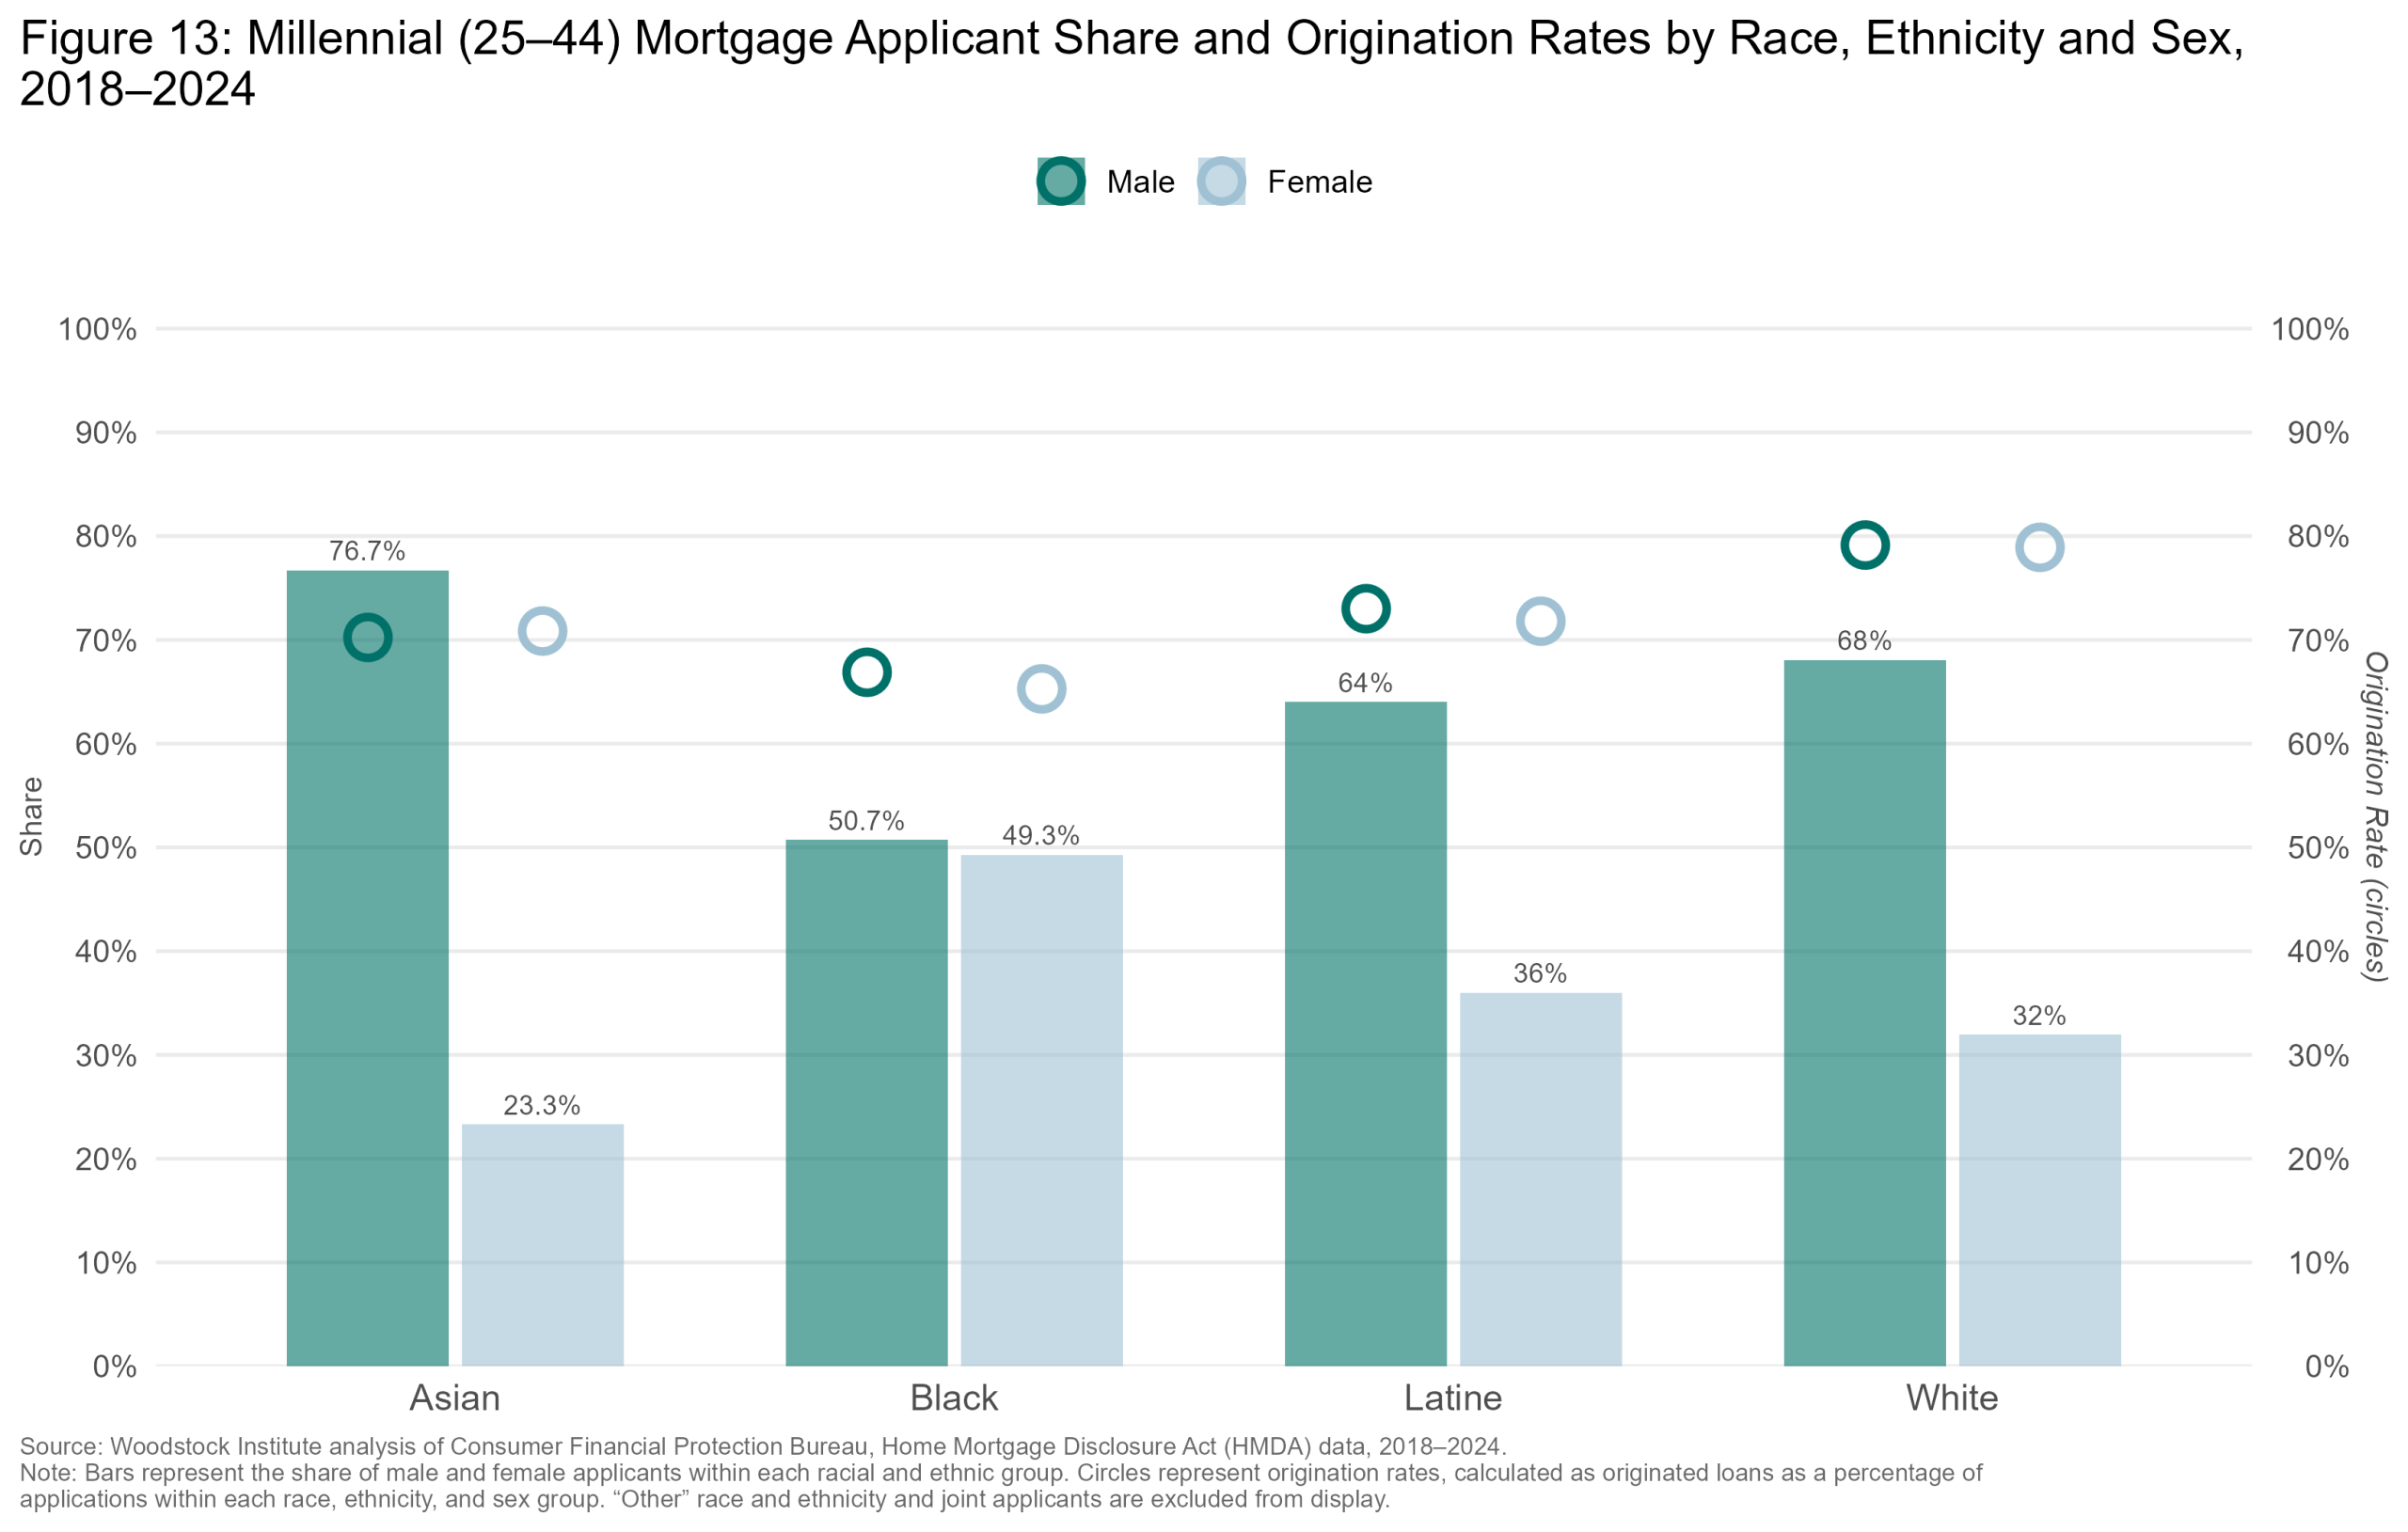
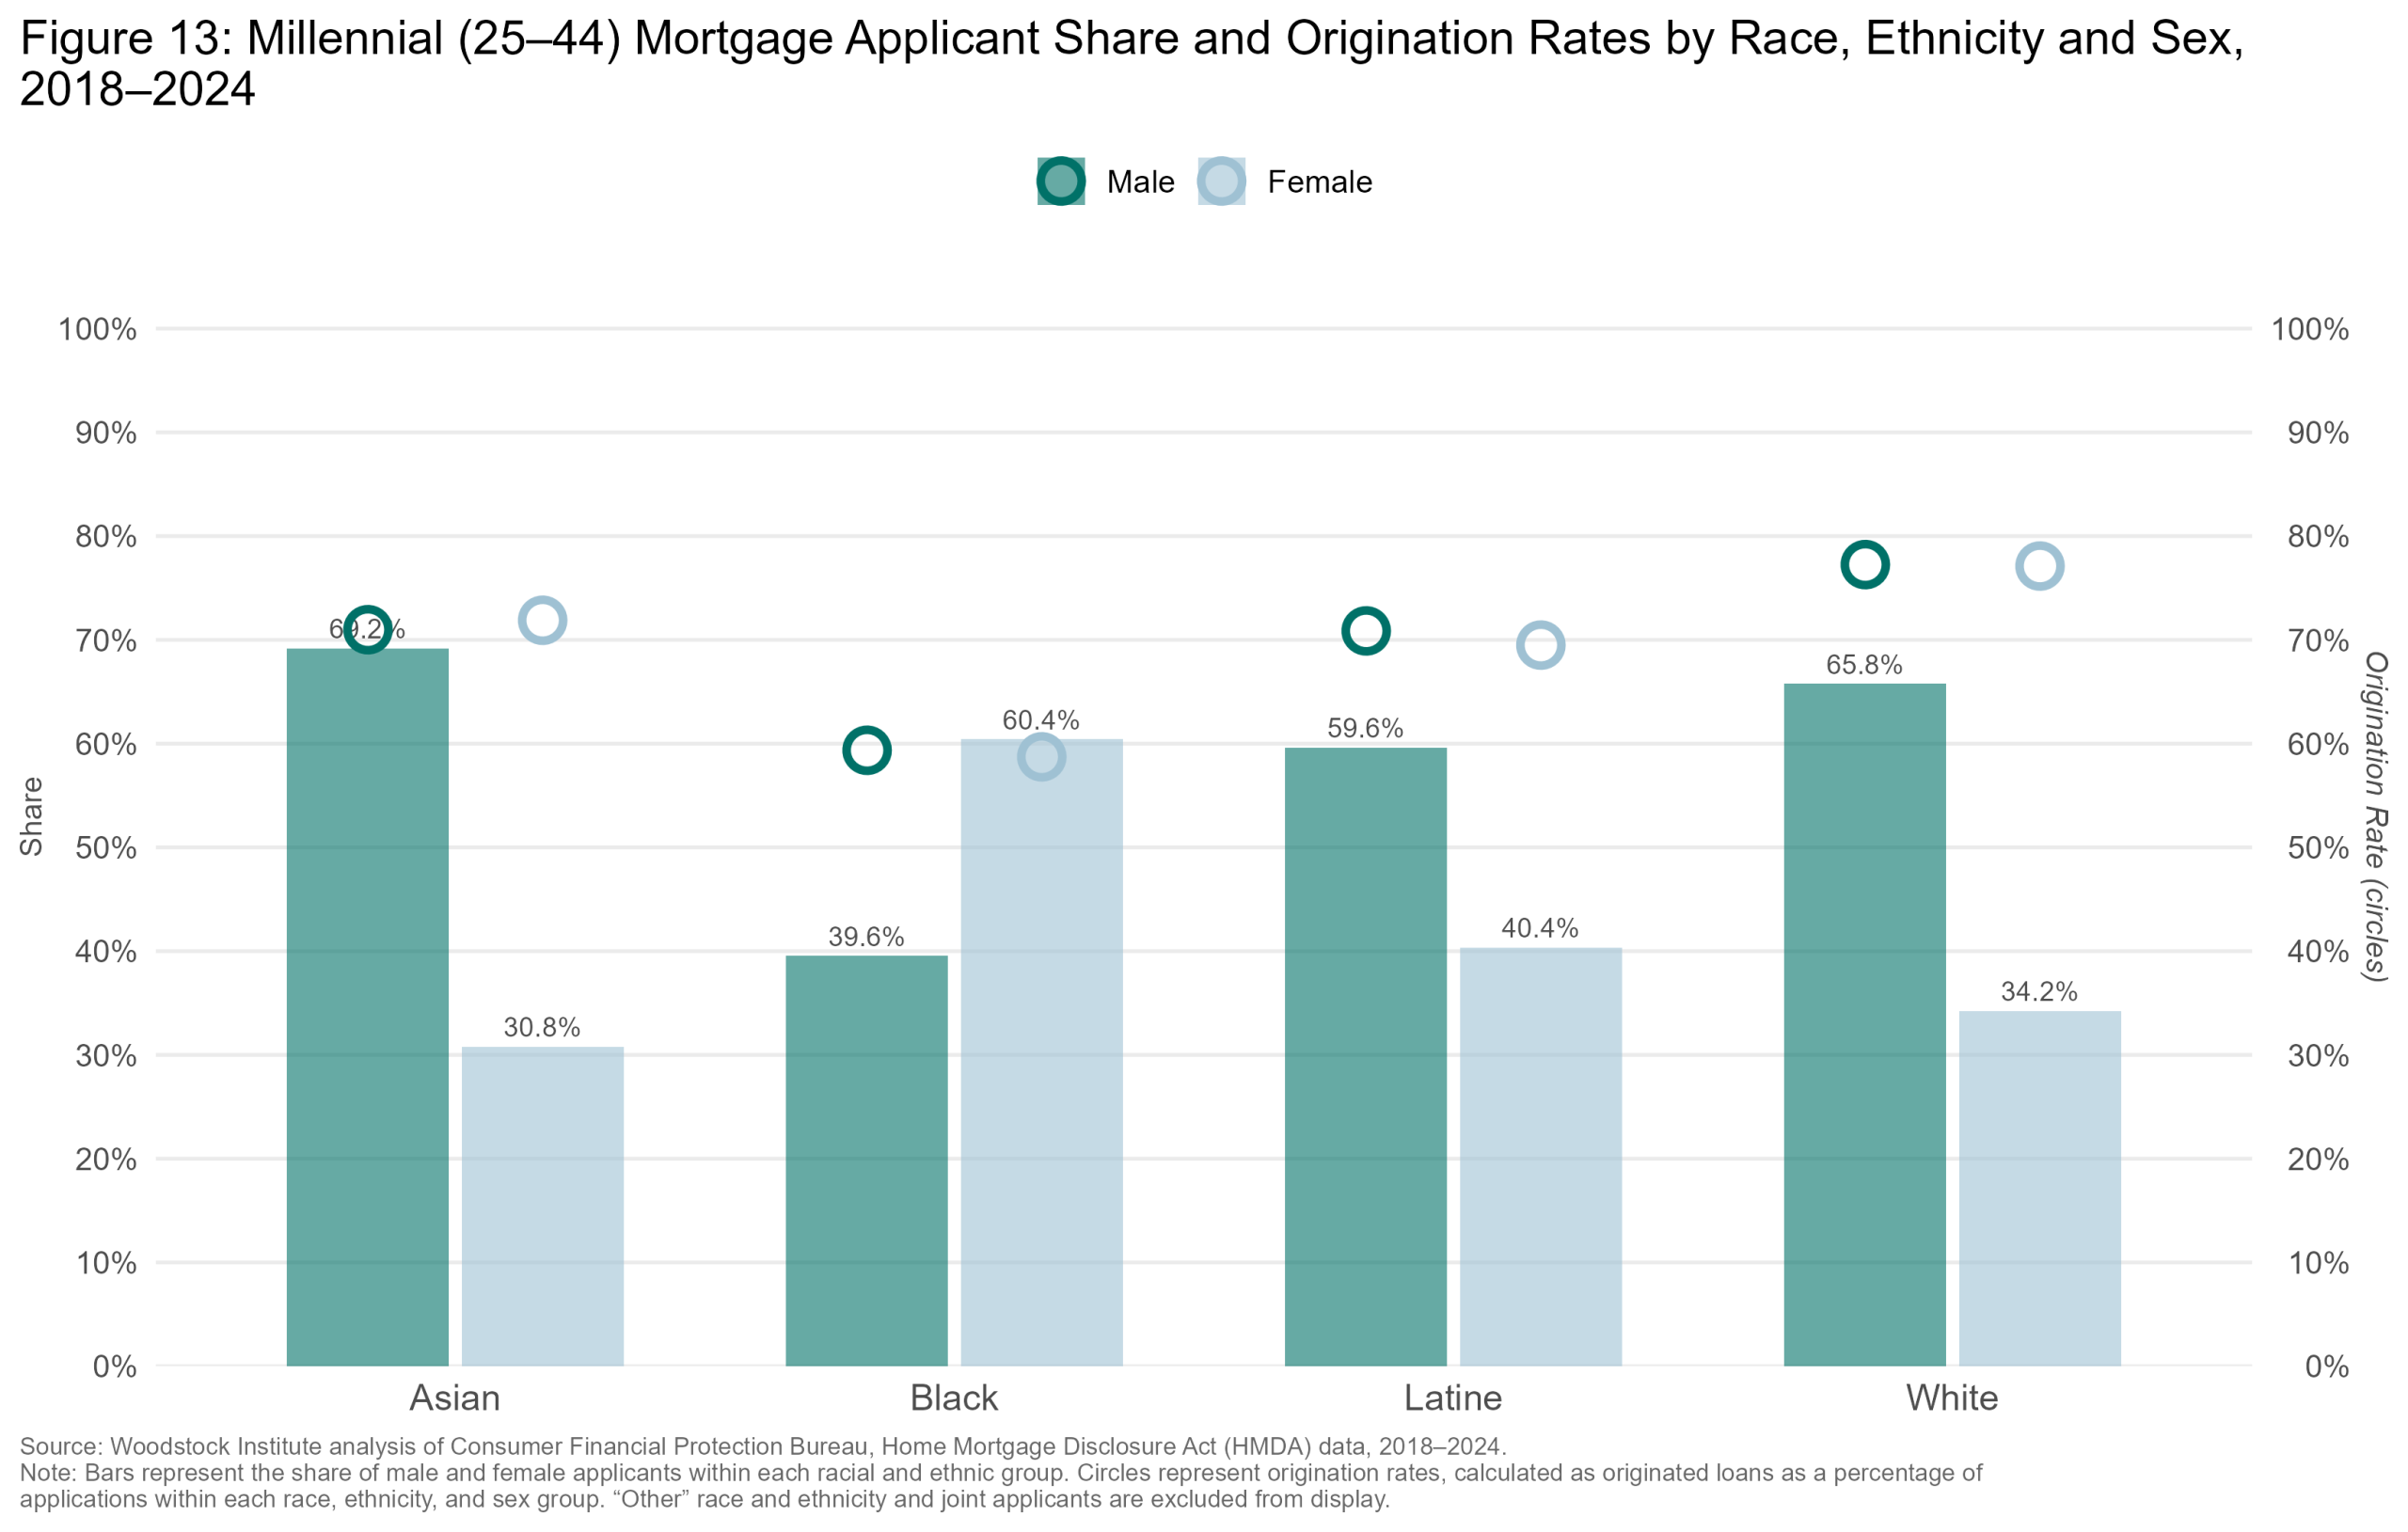
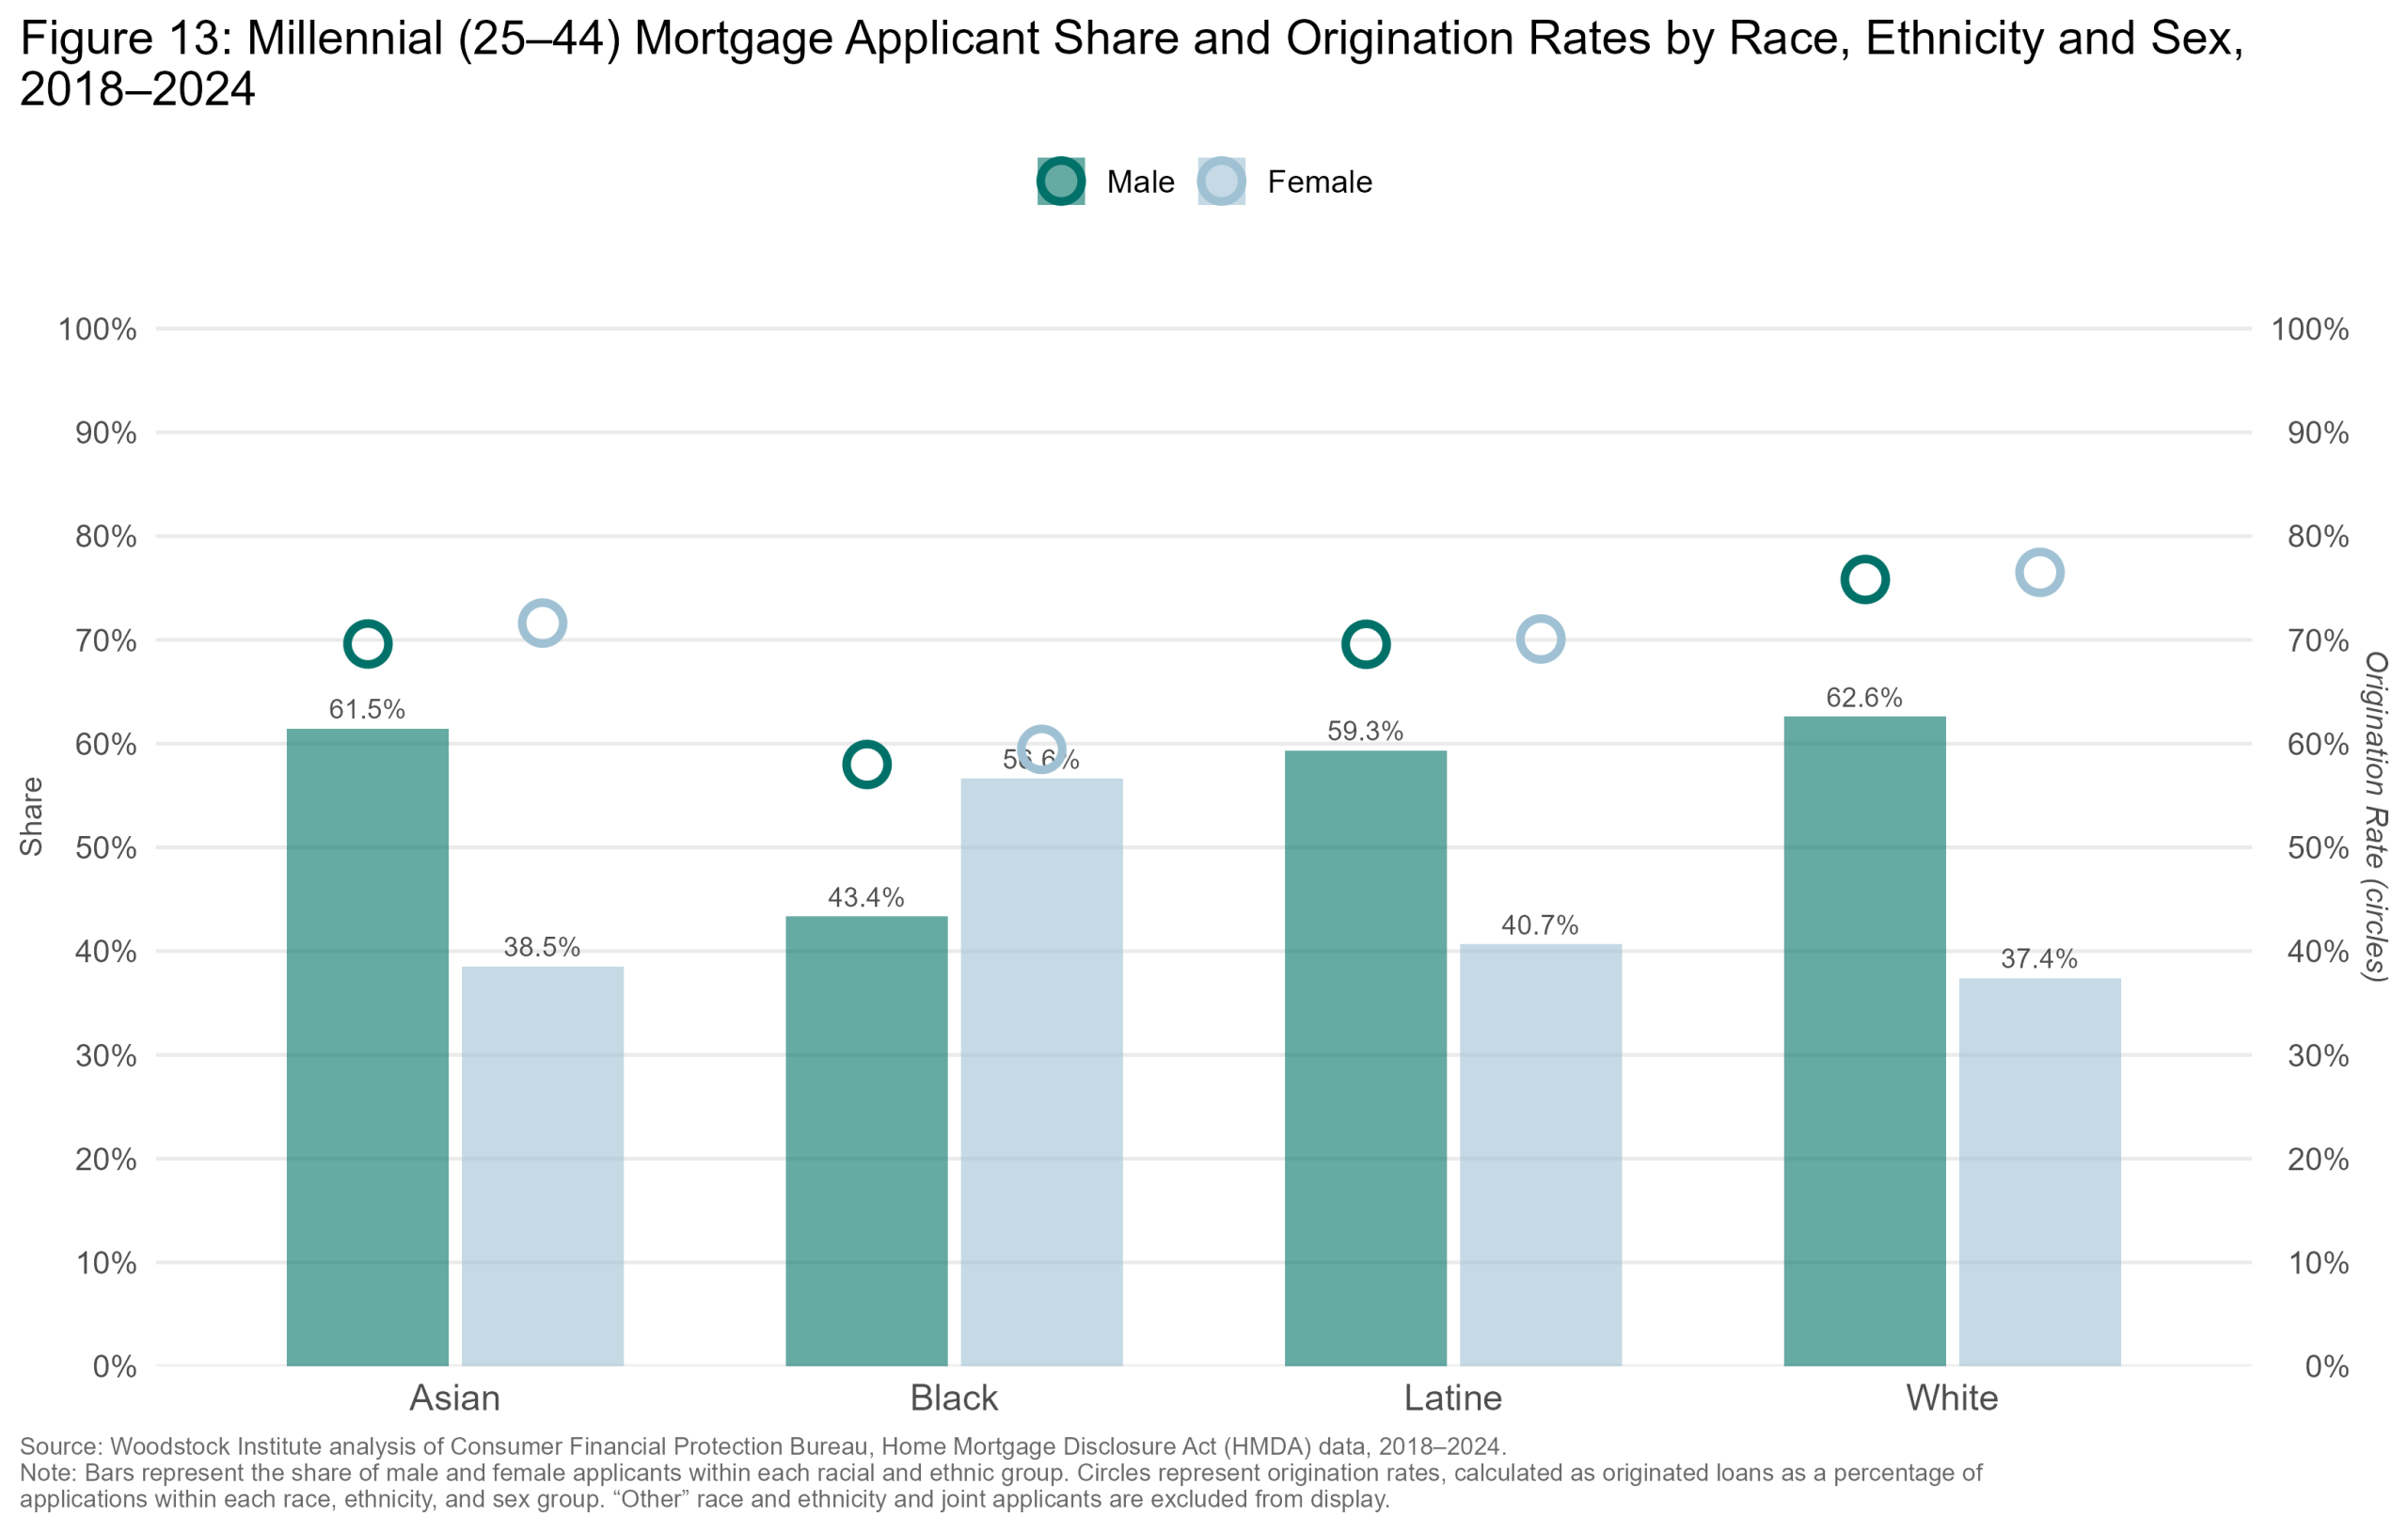
Unlike the racial patterns documented throughout the report, gender composition does not appear to produce a substantial difference in lending outcomes among millennials. In Illinois, male millennial applicants are the majority within most racial groups except Black applicants, where female millennial applicants are the majority at 55.4 percent. This pattern is consistent across suburban Cook County and Chicago; only the six collar counties have all male majorities and only a 1.4 percentage point lead for Black male applicants compared to Black female applicants. Despite this gender gap in applications, origination rates between male and female applicants showed minimal disparities. (Figure 13)
plot_sex_combined_Illinois.png / .jpg / .jpegCheck the file exists in the graphs folder and that this HTML is opened from a browser with local file access enabled.
plot_sex_combined_Six_Collar.png / .jpg / .jpegCheck the file exists in the graphs folder and that this HTML is opened from a browser with local file access enabled.
plot_sex_combined_Suburban_Cook.png / .jpg / .jpegCheck the file exists in the graphs folder and that this HTML is opened from a browser with local file access enabled.
plot_sex_combined_Chicago.png / .jpg / .jpegCheck the file exists in the graphs folder and that this HTML is opened from a browser with local file access enabled.
Loan amounts, borrower income, loan cost, loan type, and lender type
The financial positioning, origination rates, and denial rates alone do not explain the full lending picture for those entering the market. Looking at how much millennials earn relative to their loan amounts, how much it costs to obtain a loan, what type of loan they accessed, and who they borrowed from, provides a fuller picture of borrowers’ financial exposure after approval.
Loan amounts
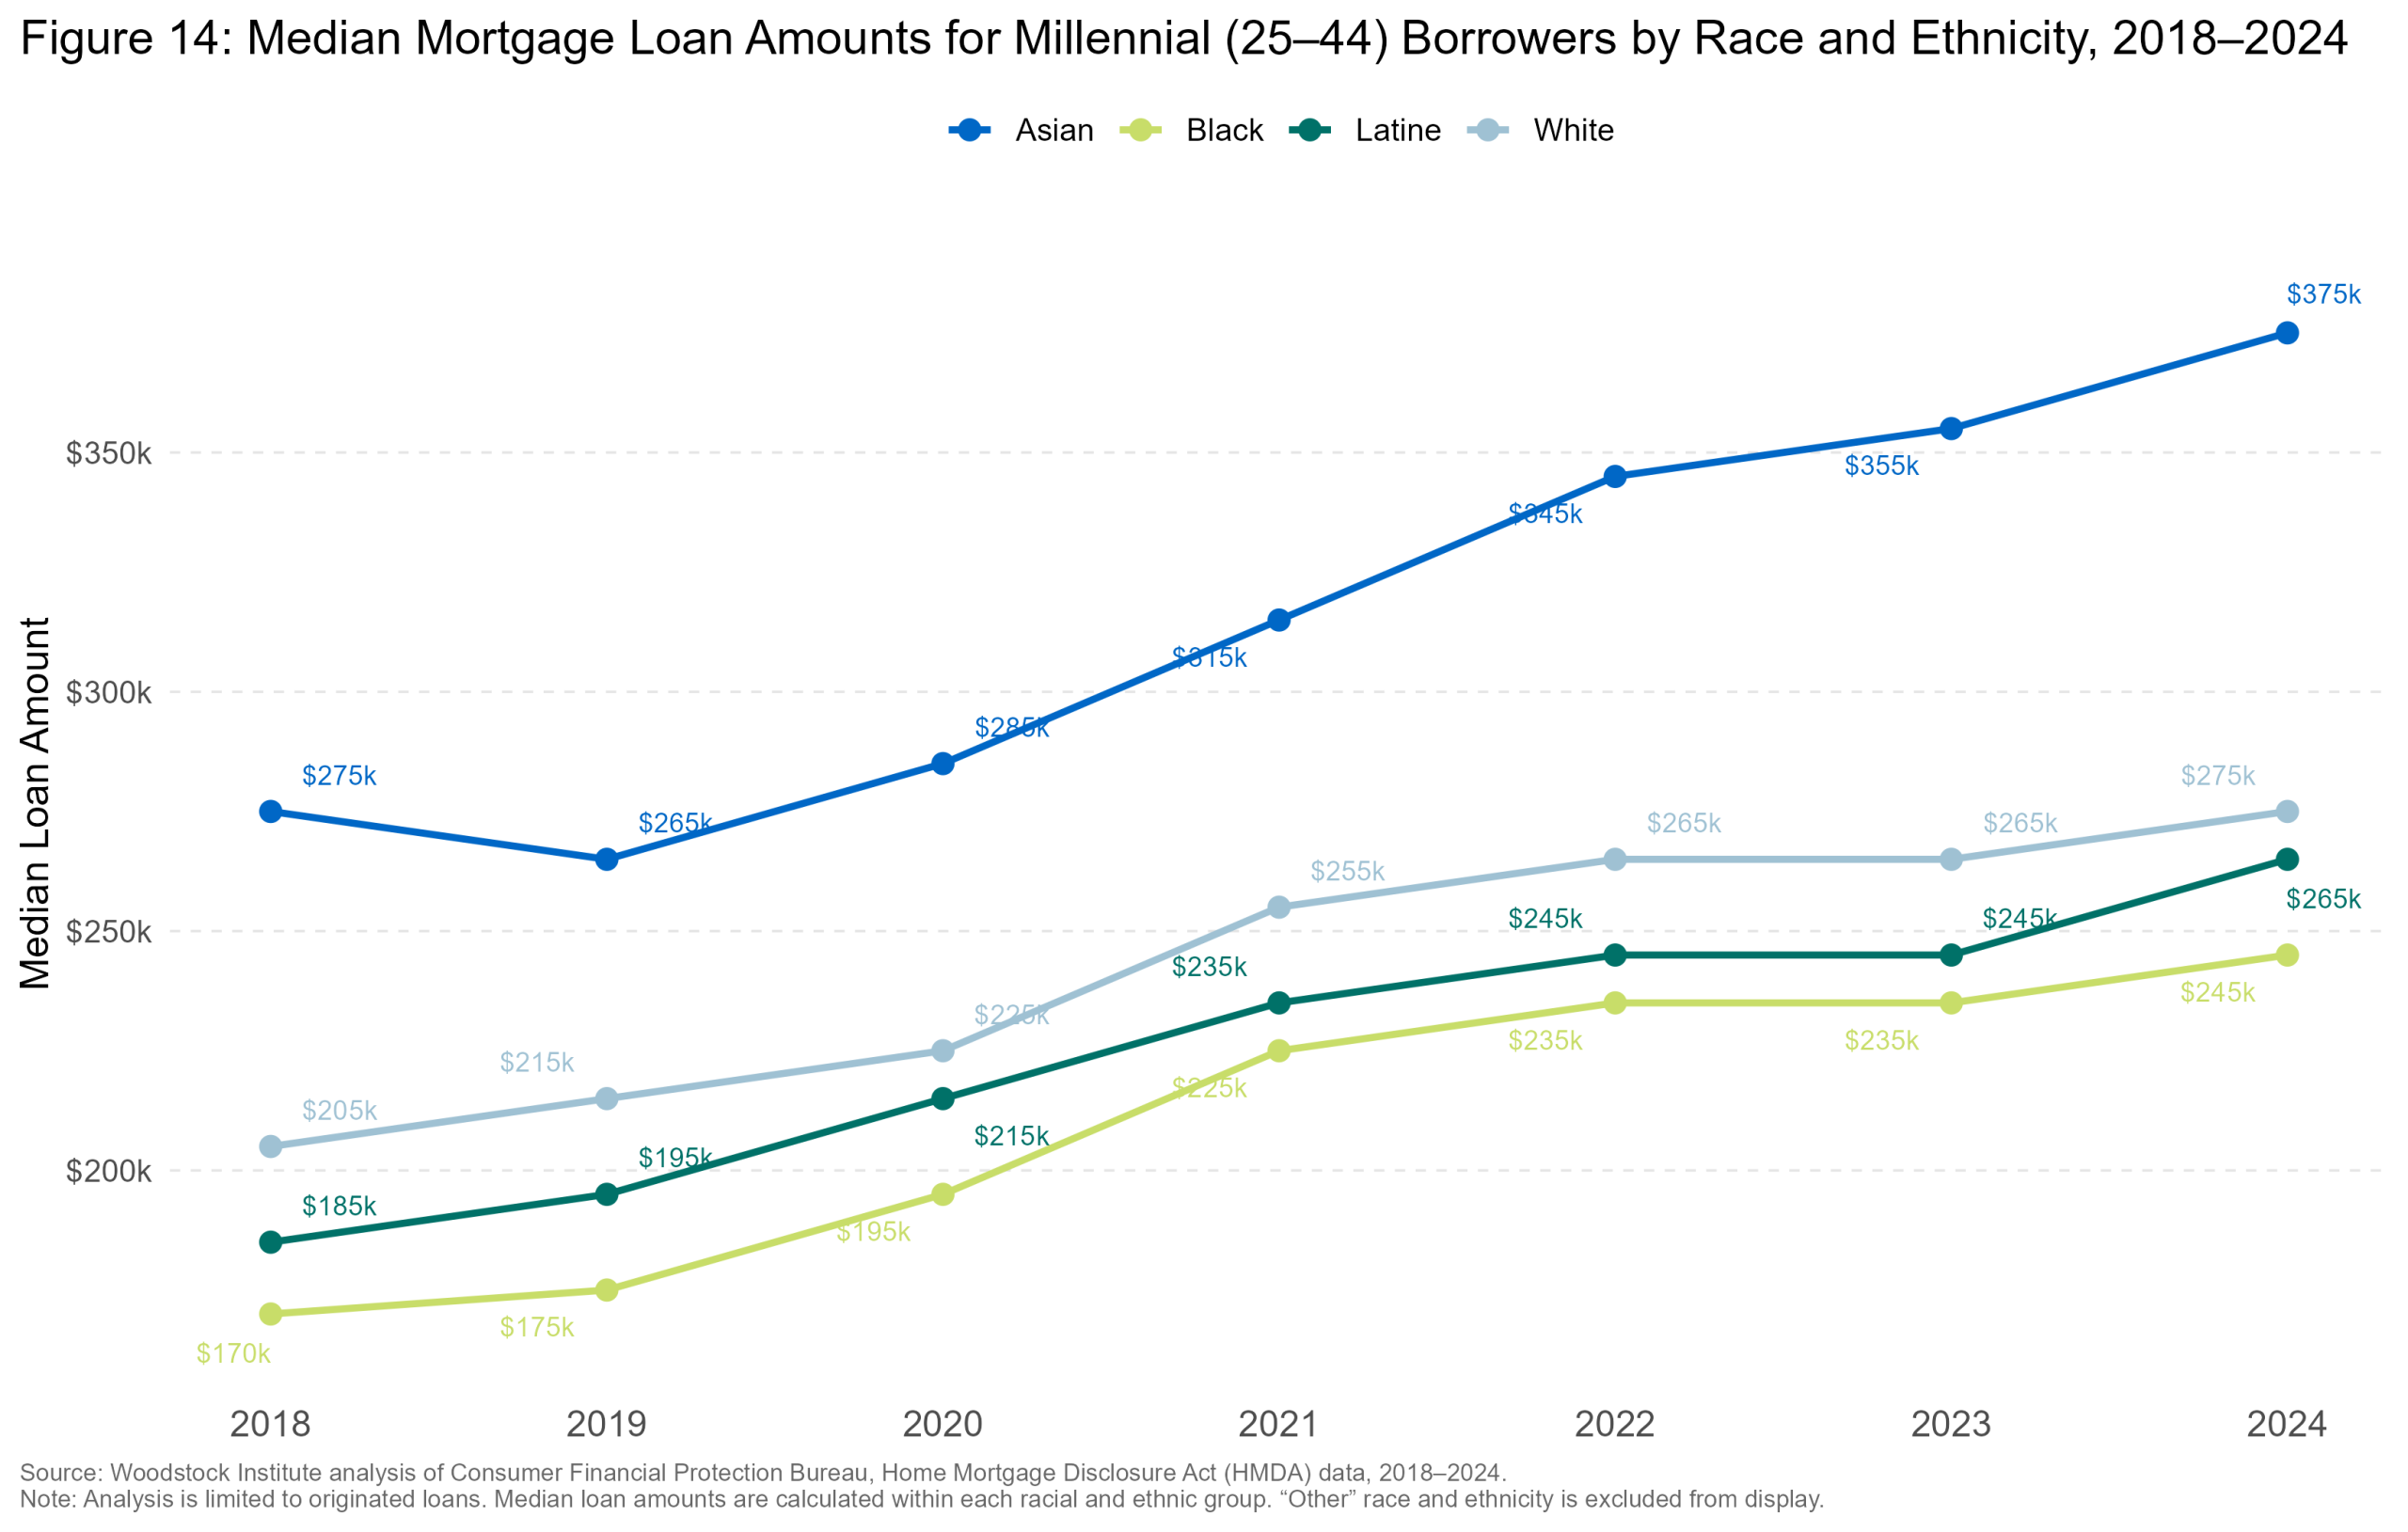
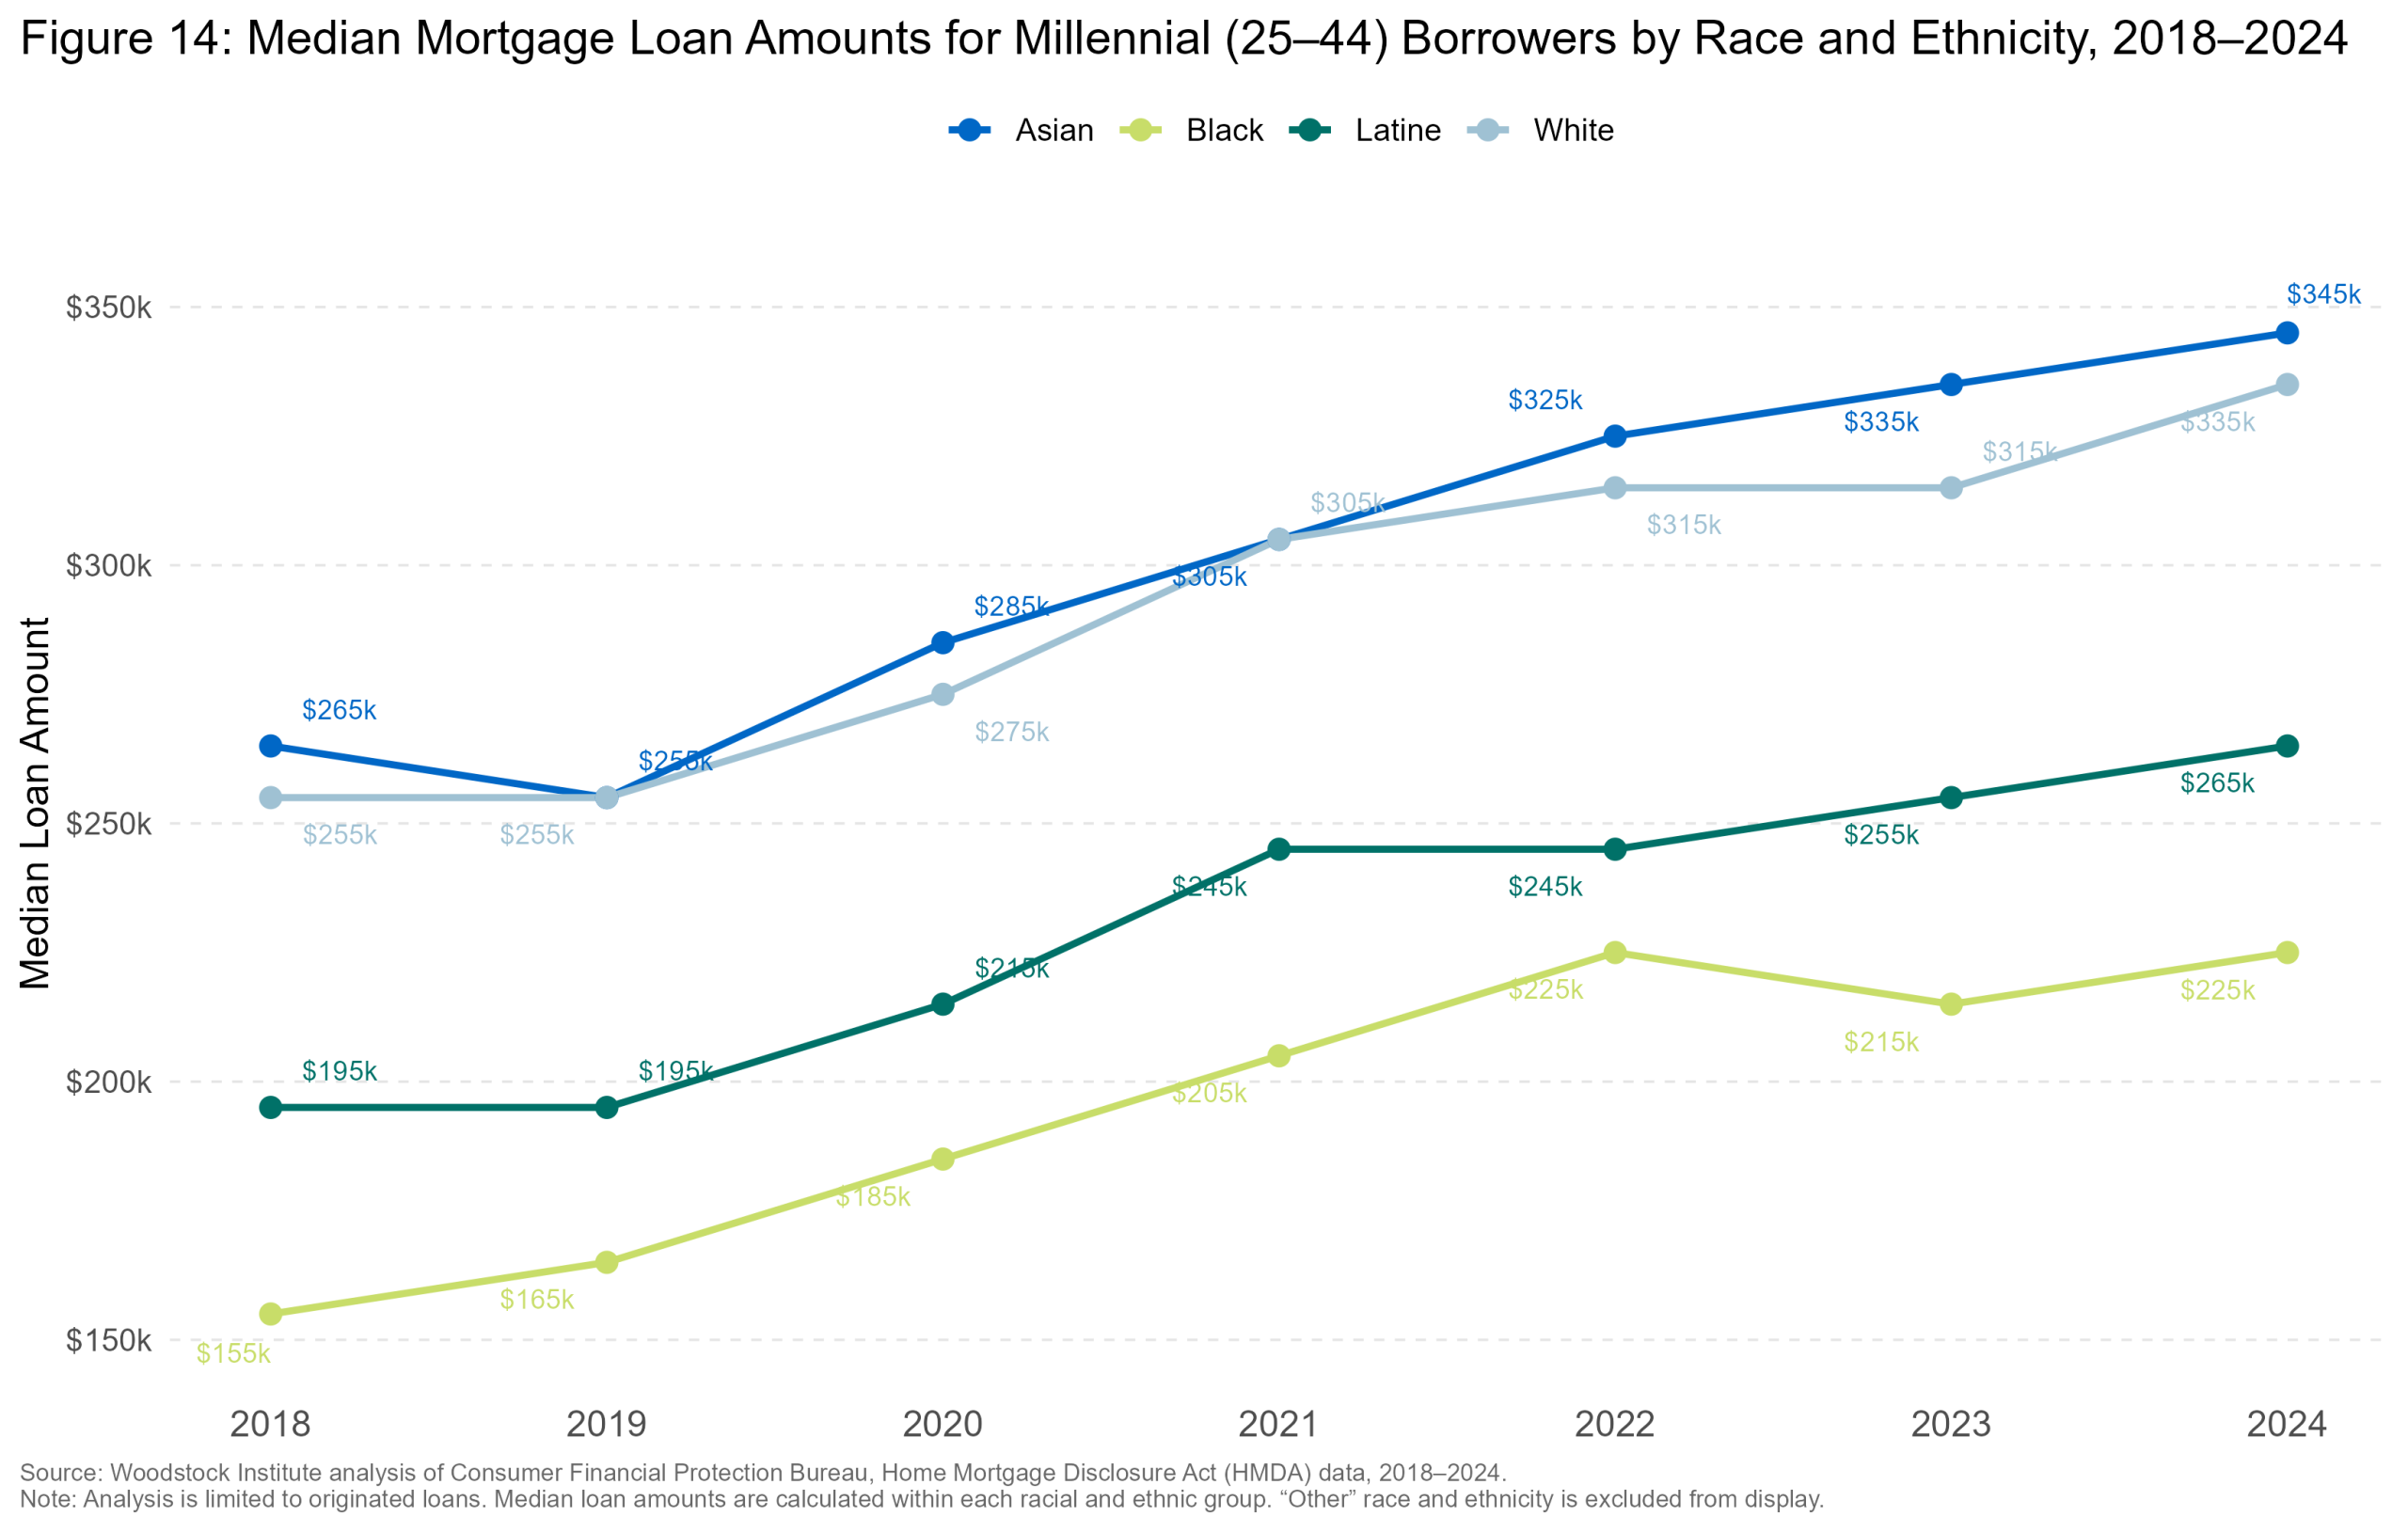
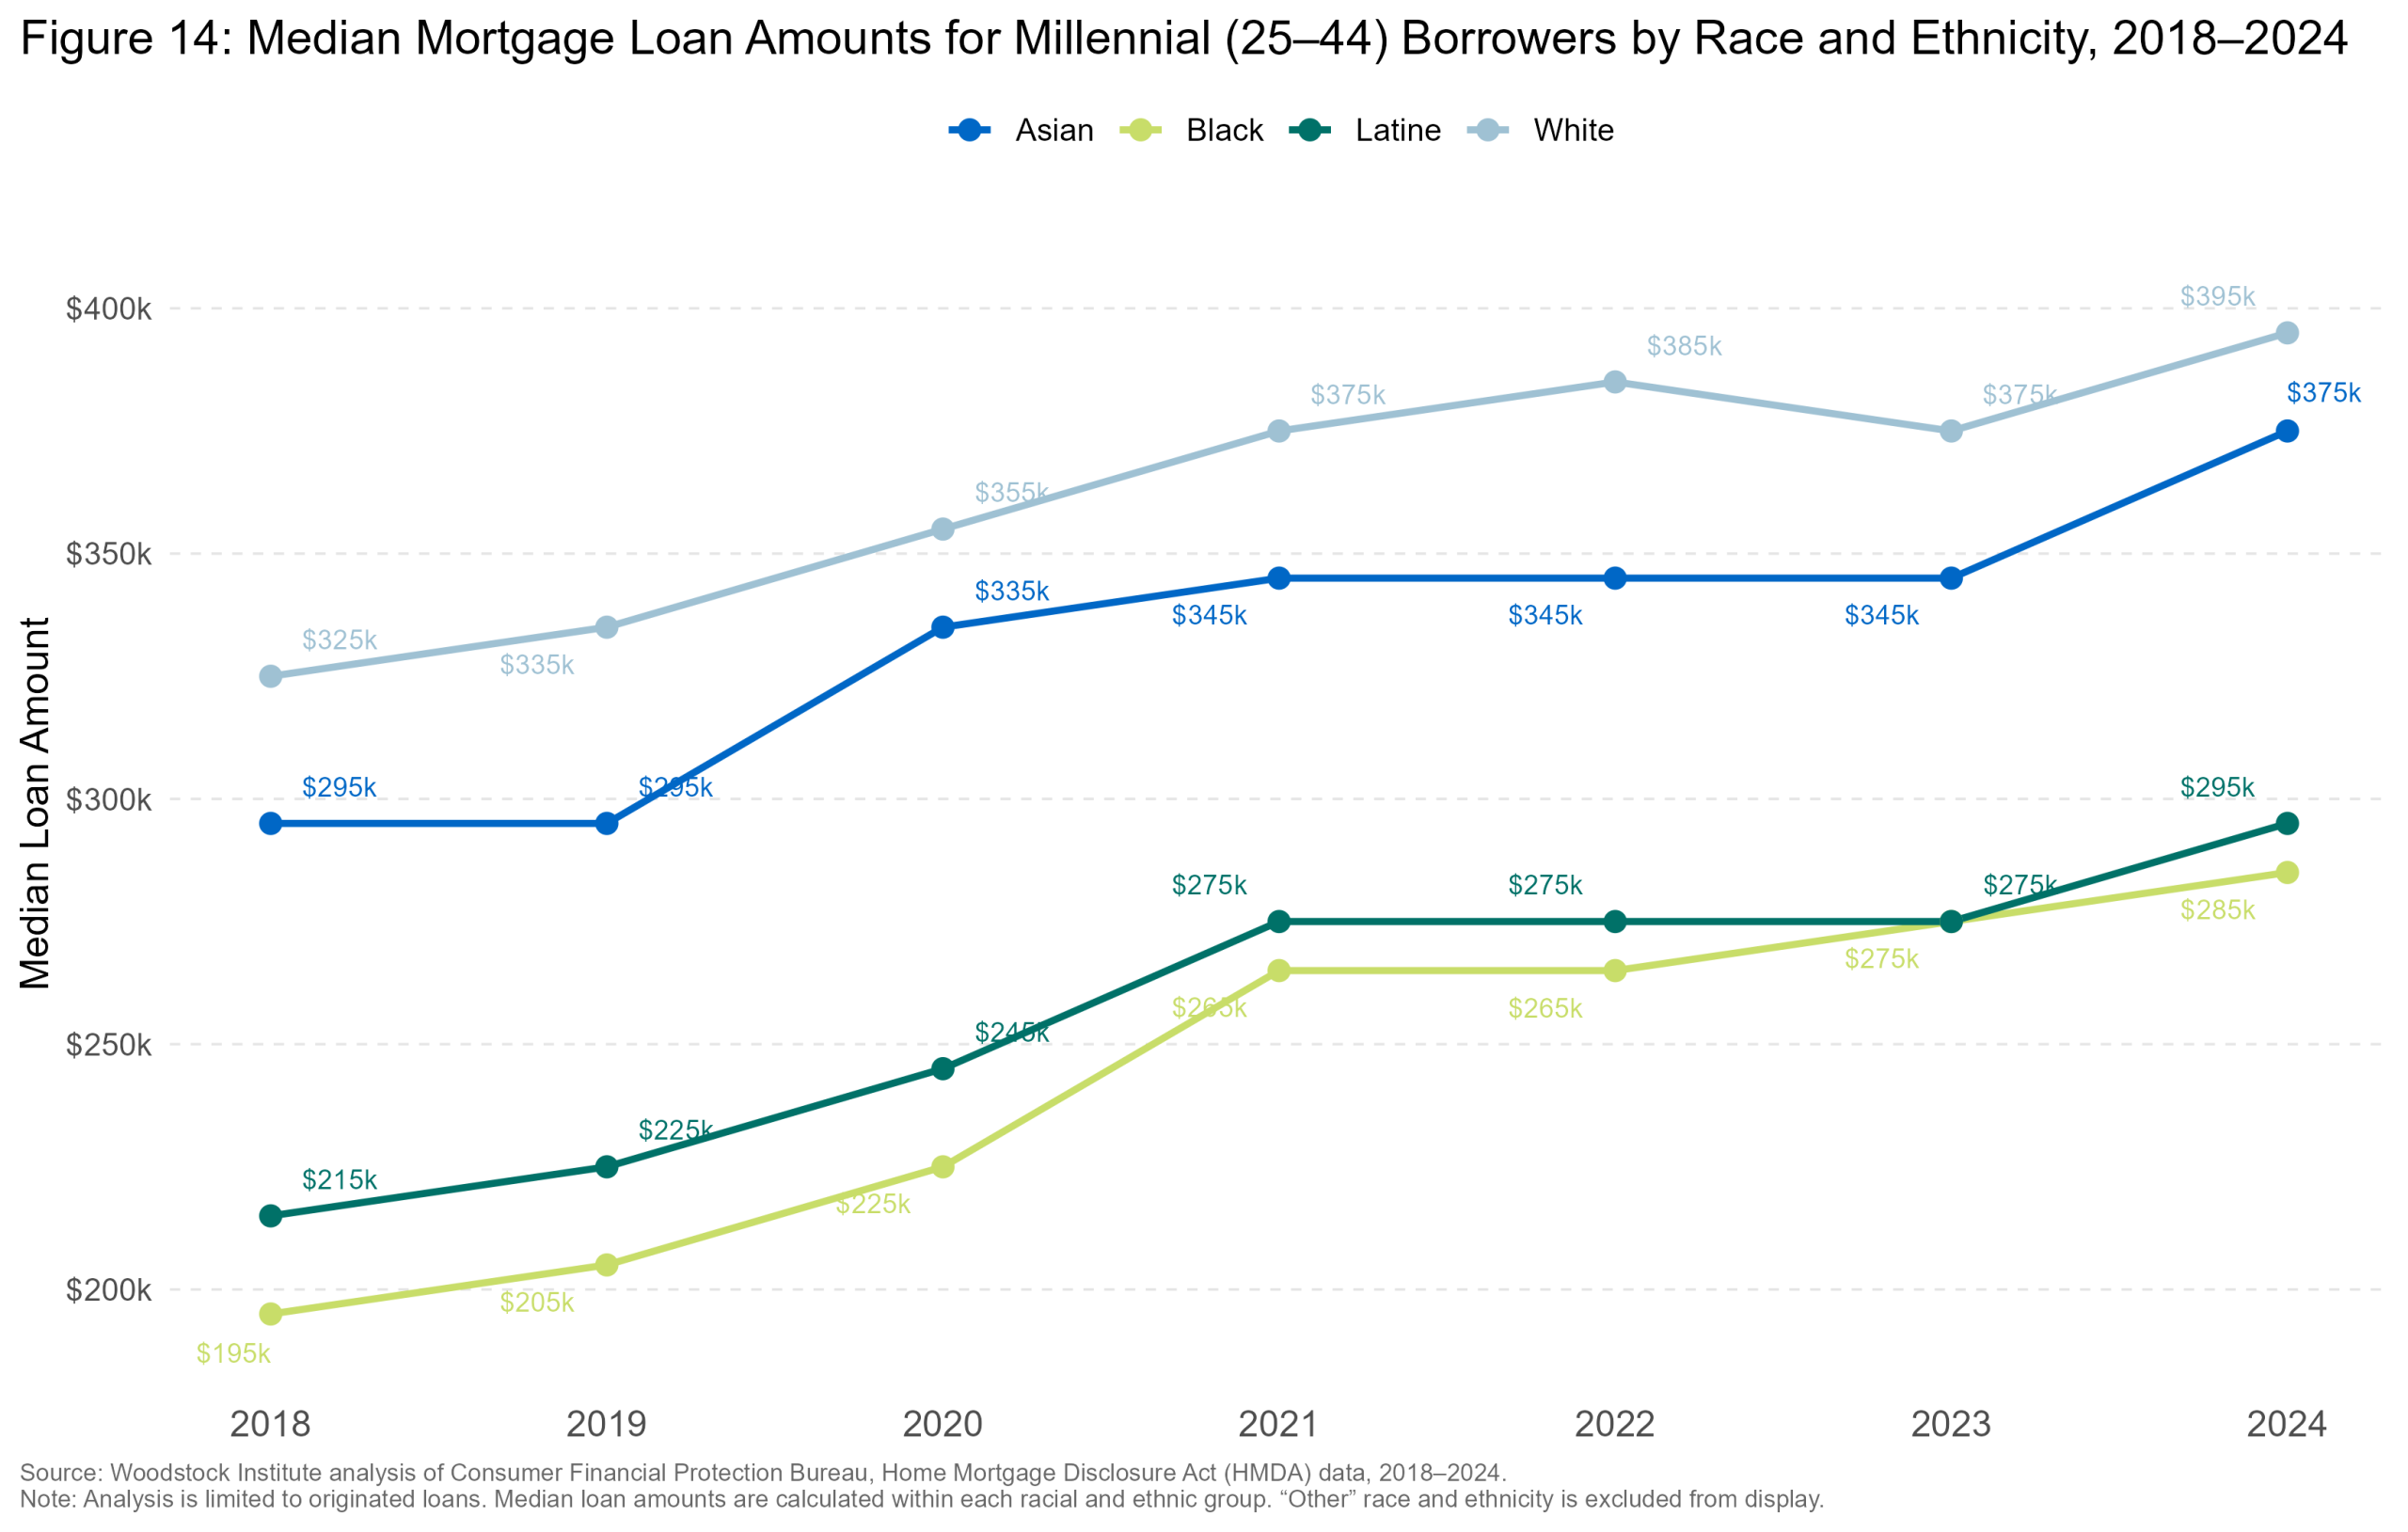
Median nominal loan amounts have risen for every racial group since 2018, but the gap in loan amounts between racial groups has widened rather than narrowed. Asian borrowers took out the largest loans throughout the period, rising from $275,000 in 2018 to $375,000 in 2024. White borrowers followed a similar upward path but from a lower base, starting at $205,000 and increasing to $275,000. Black and Latine borrowers took out considerably smaller loans across the entire period. Latine borrowers’ loan amounts rose from $185,000 to $265,000, while Black borrowers had the lowest loan amount of any group in every year, climbing from $170,000 to $245,000. This makes sense given the disparities in income and purchasing power. By 2024, the gap between Asian and Black median loan amounts increased to $130,000, up from $105,000 in 2018. (Figure 14)
plot_loan_amt_trend_Illinois.png / .jpg / .jpegCheck the file exists in the graphs folder and that this HTML is opened from a browser with local file access enabled.
plot_loan_amt_trend_Six_Collar.png / .jpg / .jpegCheck the file exists in the graphs folder and that this HTML is opened from a browser with local file access enabled.
plot_loan_amt_trend_Suburban_Cook.png / .jpg / .jpegCheck the file exists in the graphs folder and that this HTML is opened from a browser with local file access enabled.
plot_loan_amt_trend_Chicago.png / .jpg / .jpegCheck the file exists in the graphs folder and that this HTML is opened from a browser with local file access enabled.
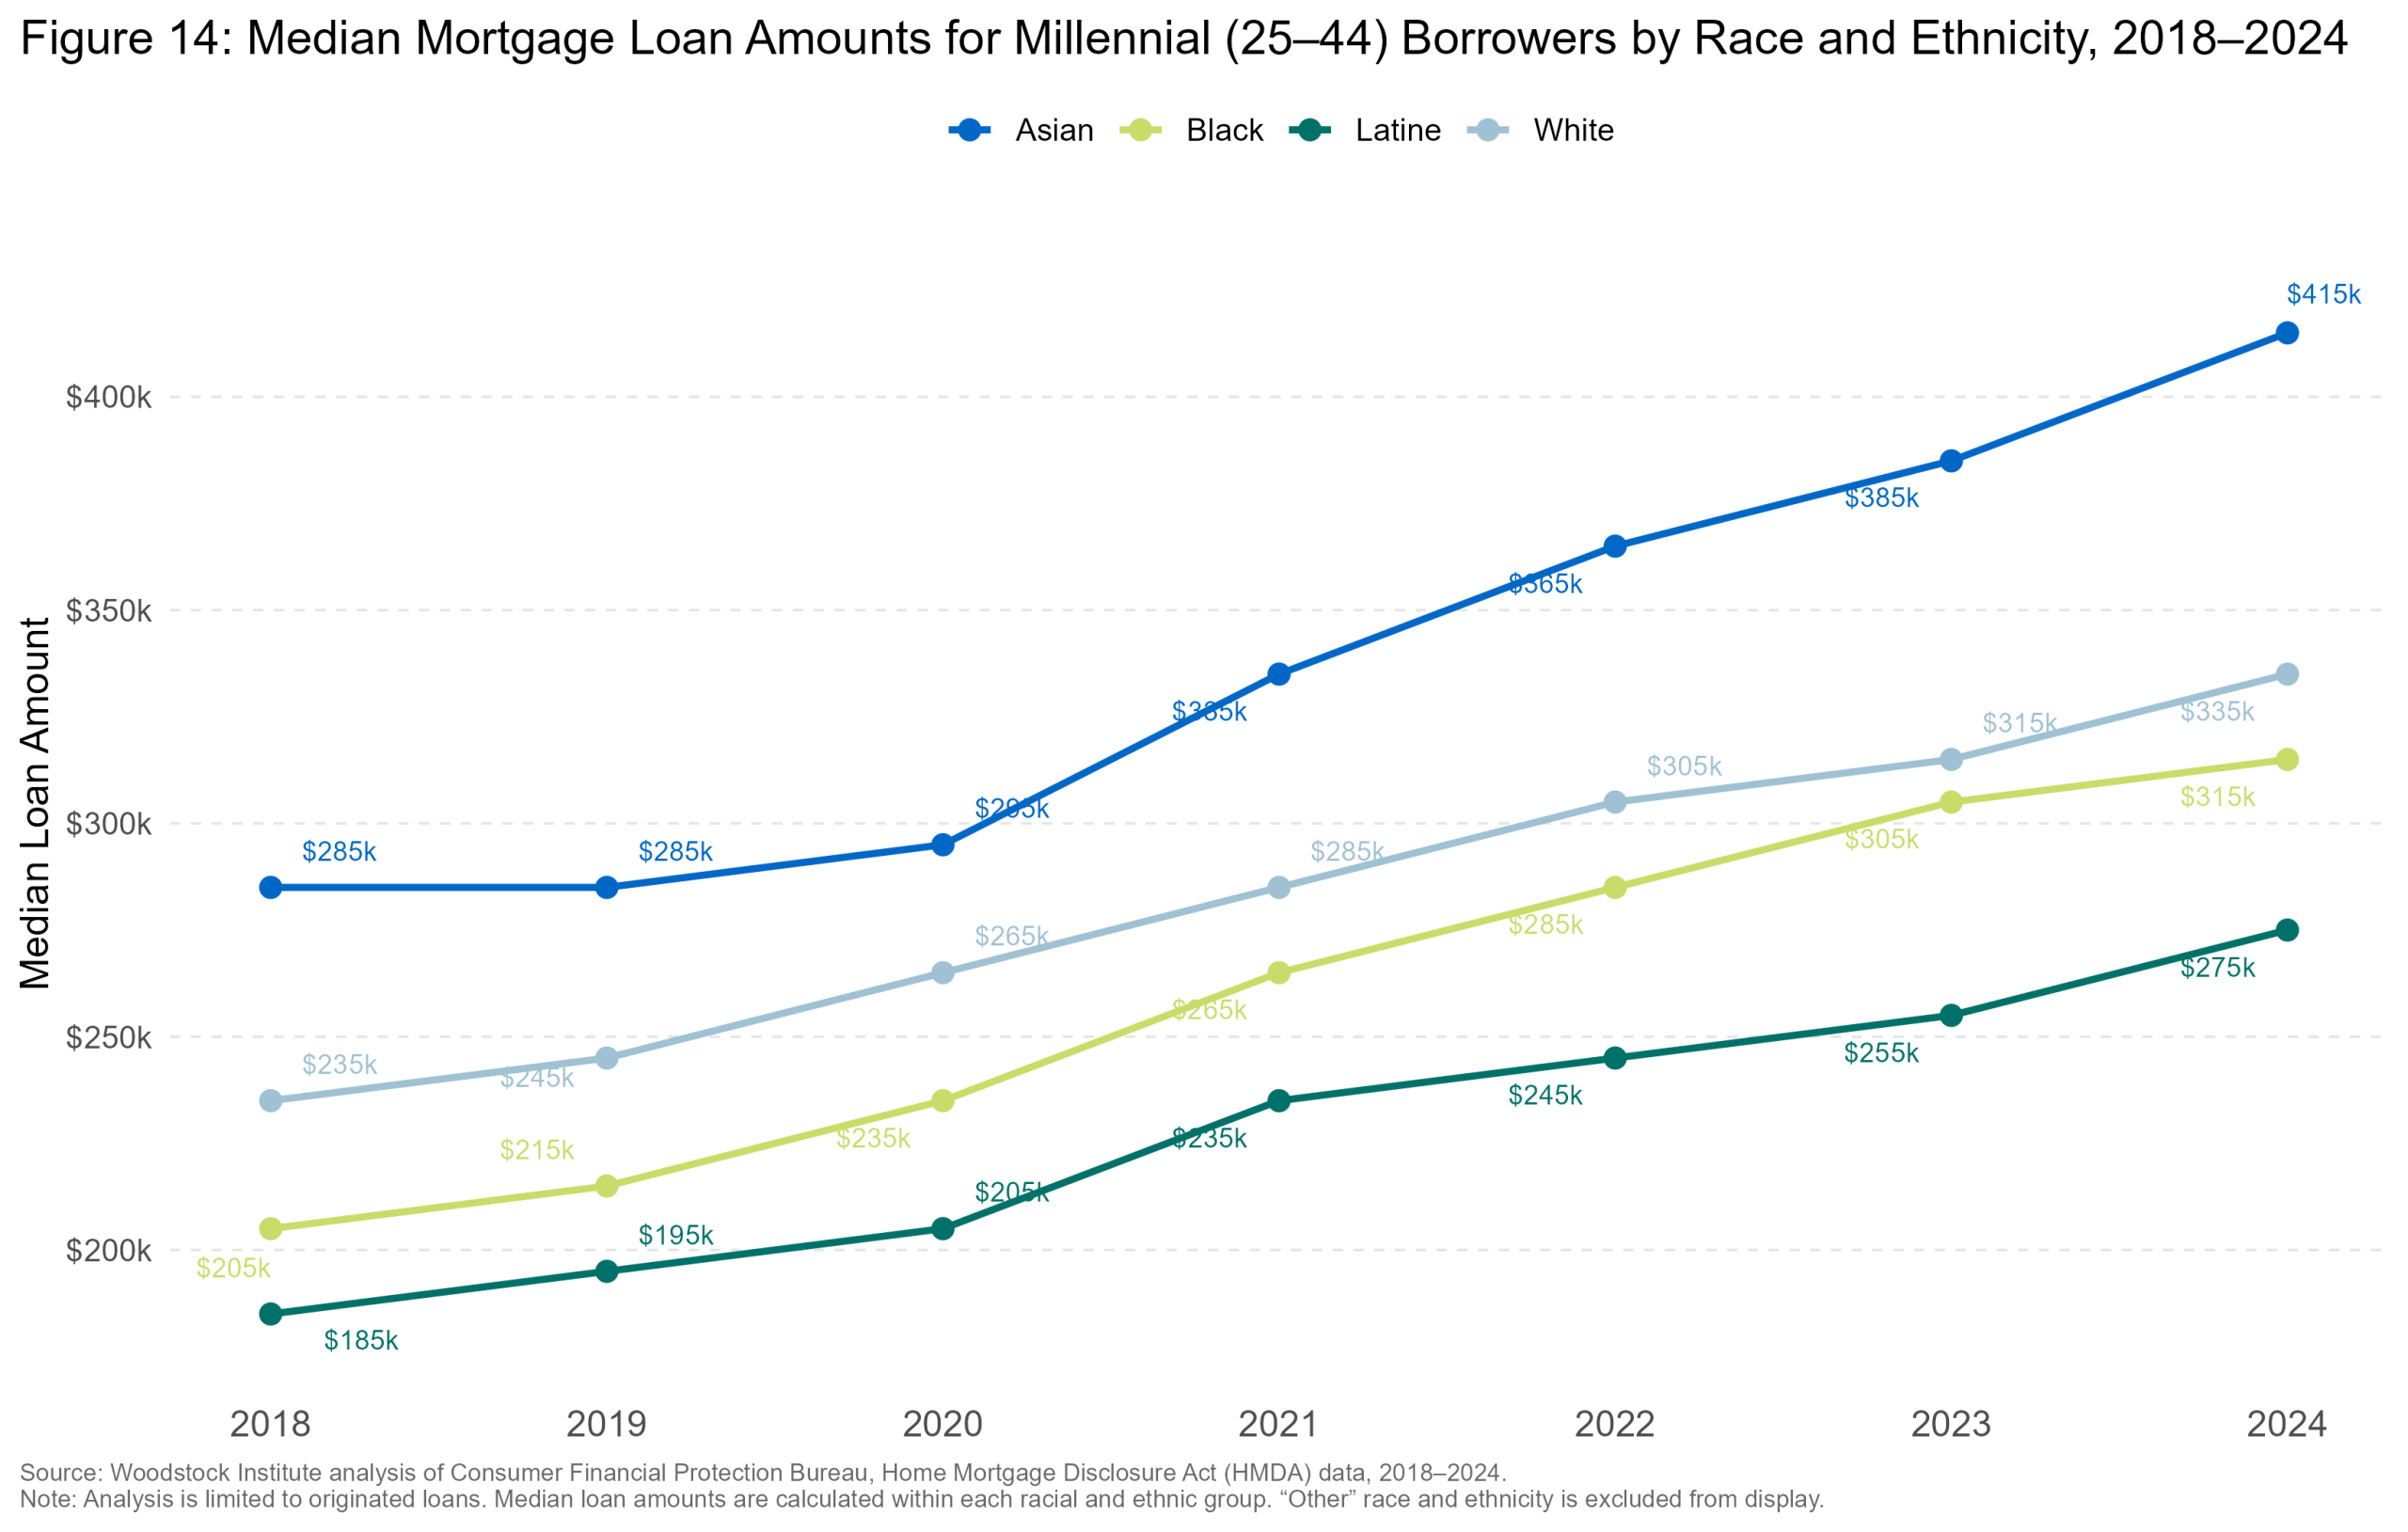
The six collar counties had a similar increase but Latine borrowers had the lowest loan amount of any group. The disparity between Asian, the highest loan amount, and Latine borrowers reached $140,000 in 2024, up from $100,000 in 2018. In suburban Cook County, Asian and White borrowers’ loan amounts had a very narrow gap, with Asian borrowers still leading. Black borrowers had the lowest loan amount, demonstrating a $120,000 gap compared to Asian borrowers in 2024, only $10,000 higher than the gap in 2018. In Chicago, White borrowers had the highest median loan amount of all groups and Black borrowers had the lowest. The gap between White and Black median loan amounts reached $110,000, and is the only gap that narrowed since 2018, by $20,000. The loan amounts alone do not indicate affordability, but coupled with DTI and CLTV, as well as the persistent disparities in access to credit, this suggests that some borrowers may be purchasing in lower-cost markets, qualifying for less credit, or face financial constraints that limit the range of homes affordable for them. (Figure 14)
The relationship between loan size and borrower income is necessary to determine which groups are carrying the greatest financial burden. The next section compares the median loan amounts to incomes to understand which group faces the most affordability pressures.
Median loan-to-income
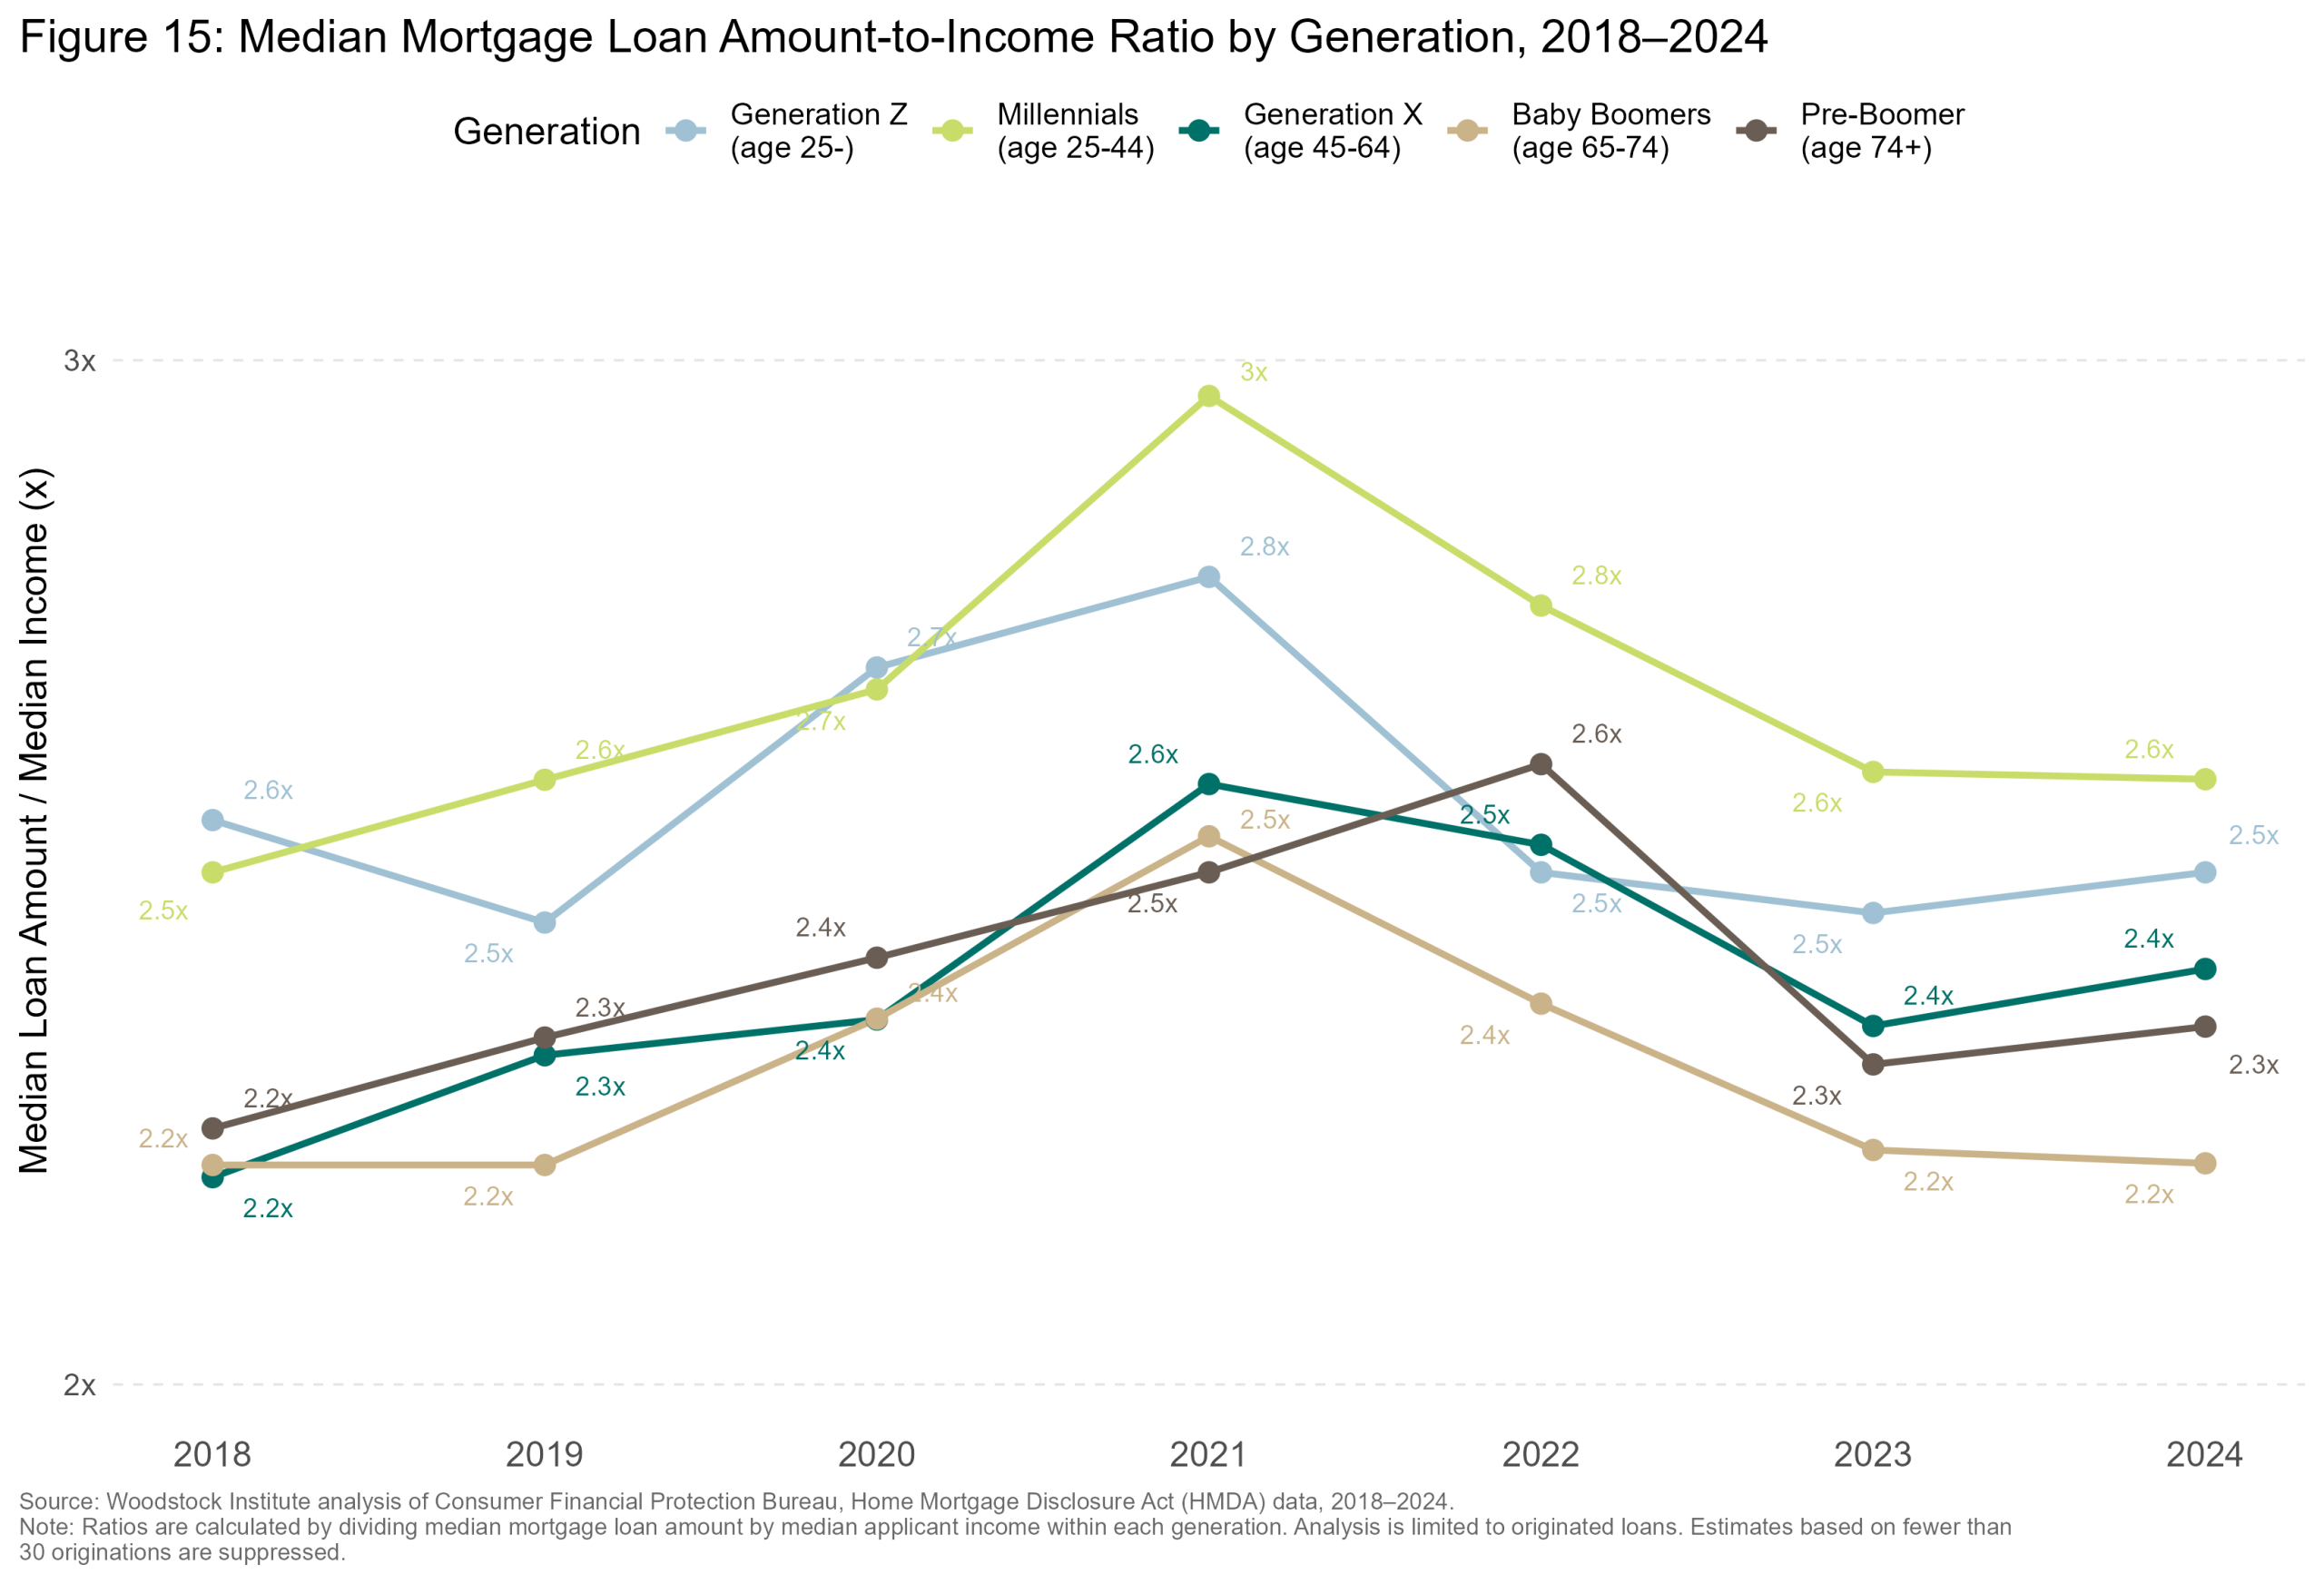
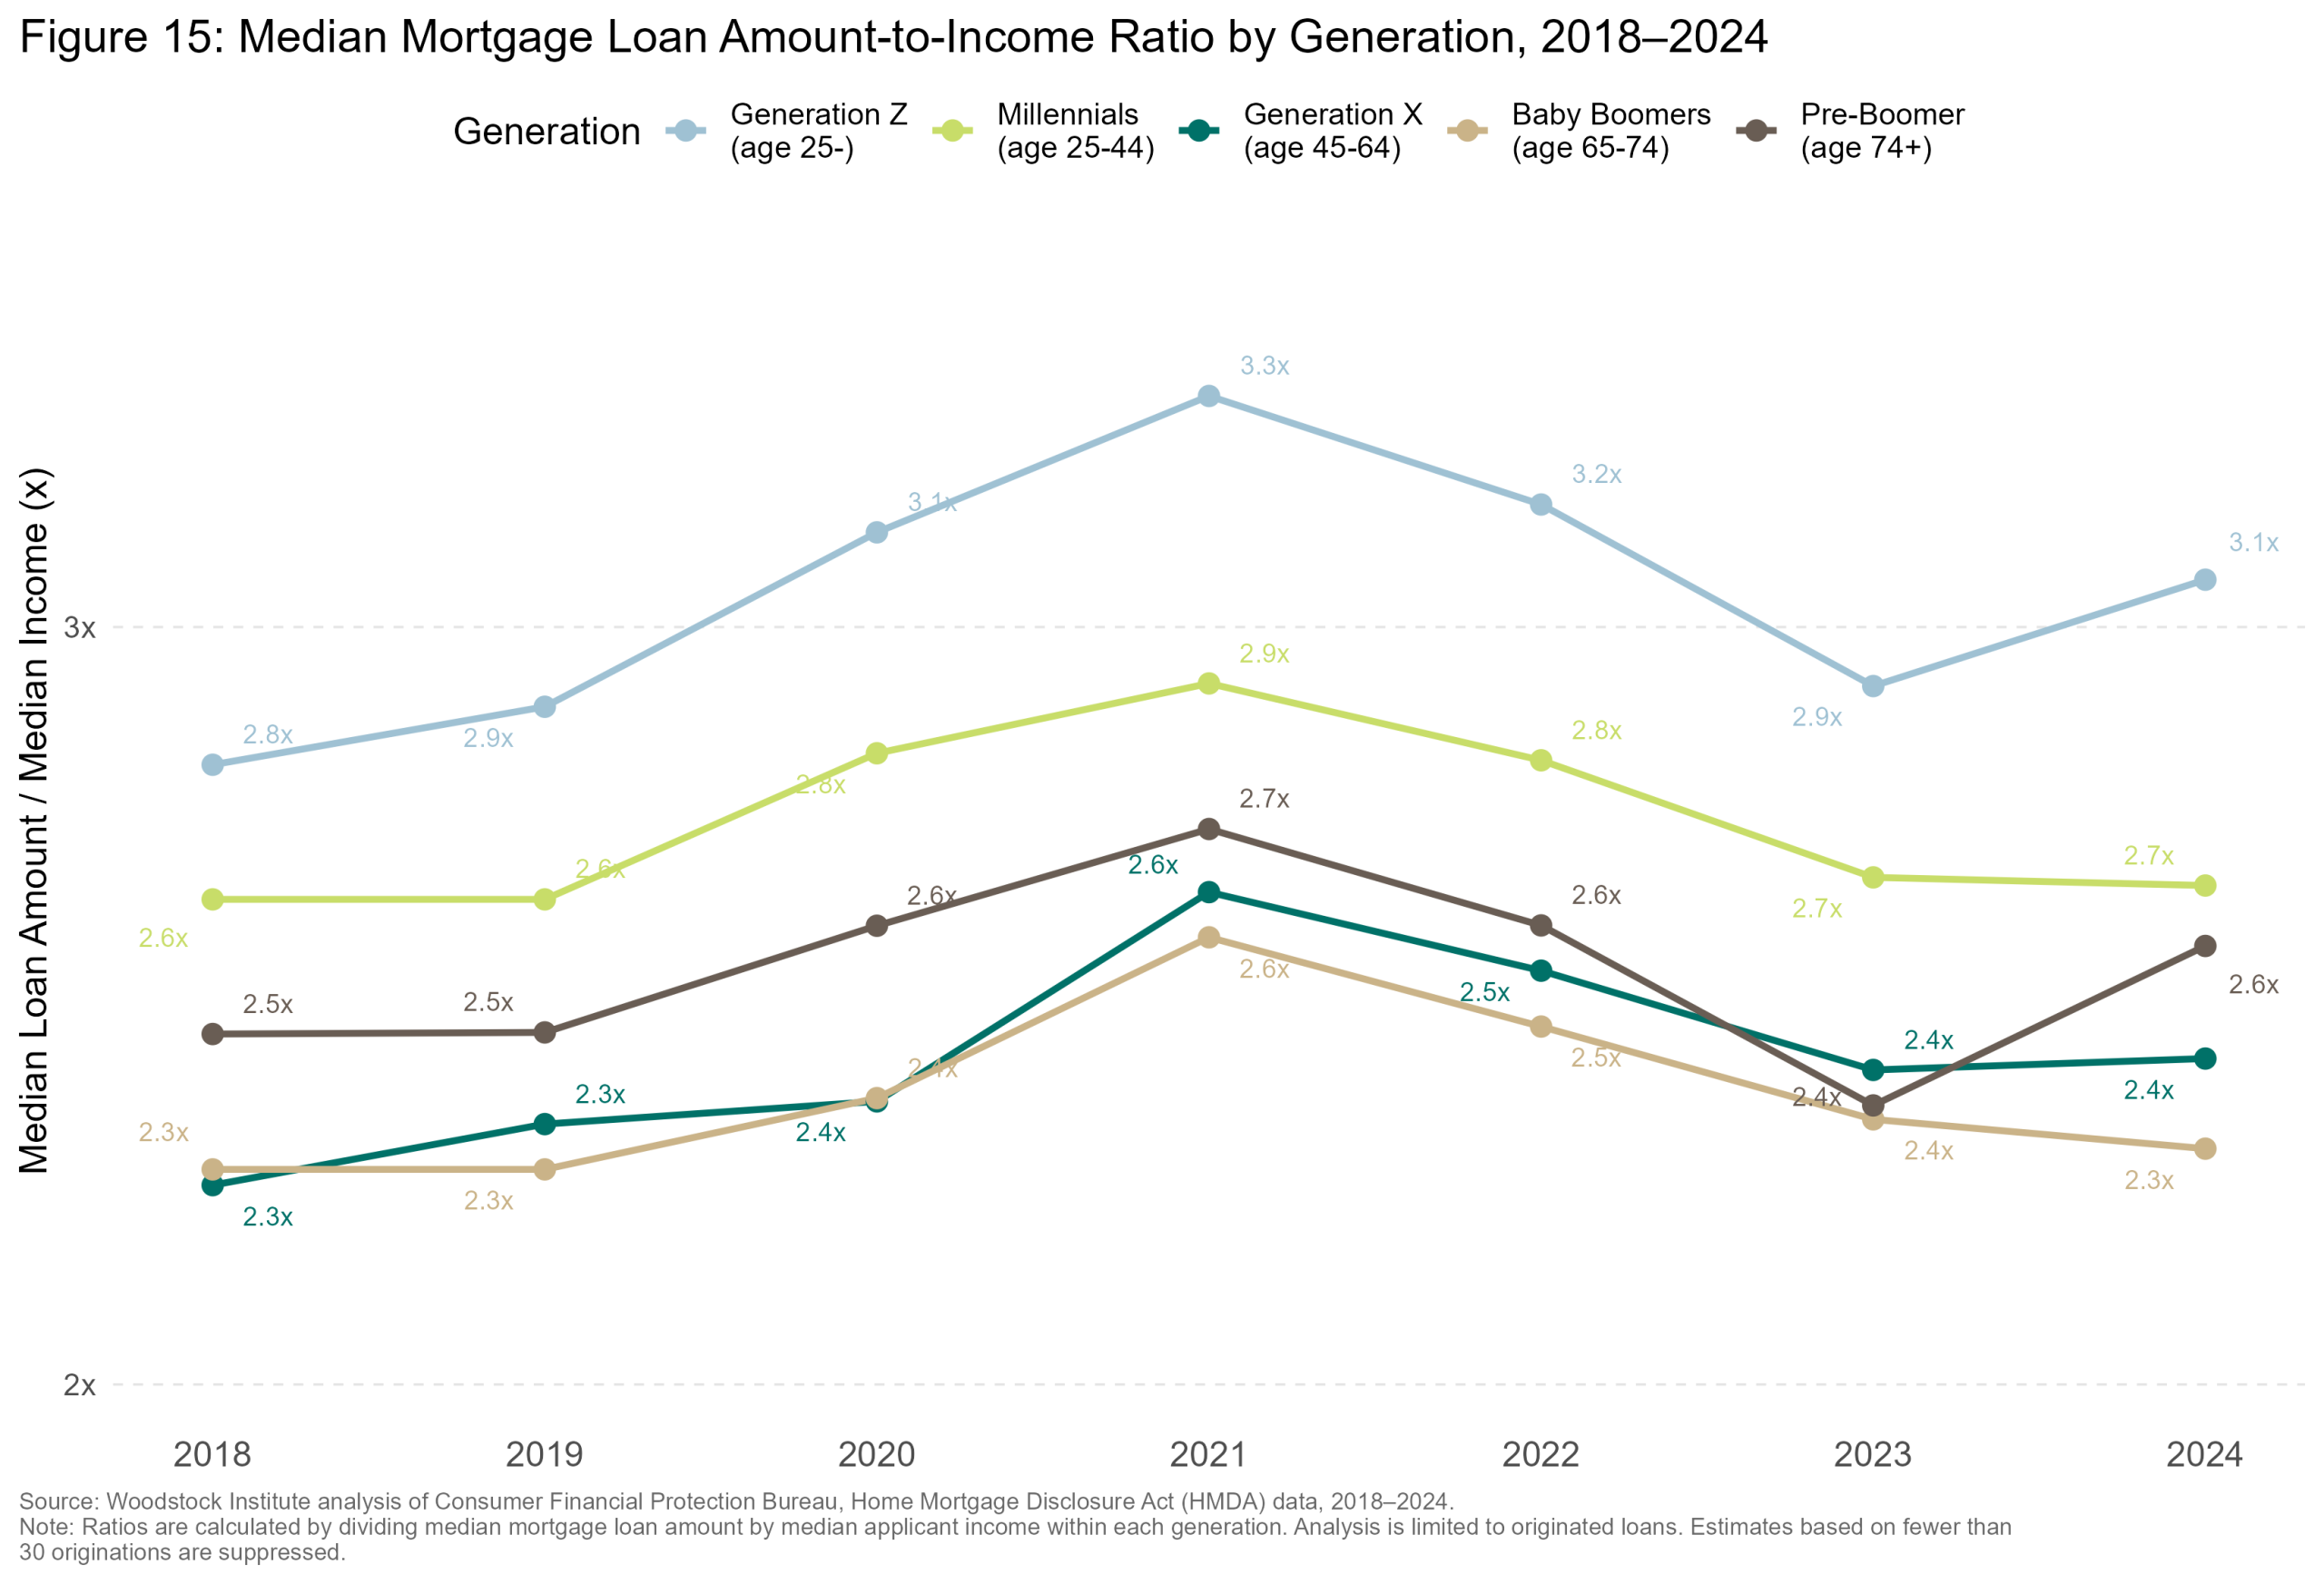
Comparing median income to median loan amounts, millennials and younger generations are stretched further than older generations in Illinois. Statewide, 2018–2024, the median incomes for White and Asian millennial applicants are much higher at $94,000 and $119,000, respectively, compared to Black and Latine millennial borrowers, with a median income of $74,000 and $72,000, respectively.
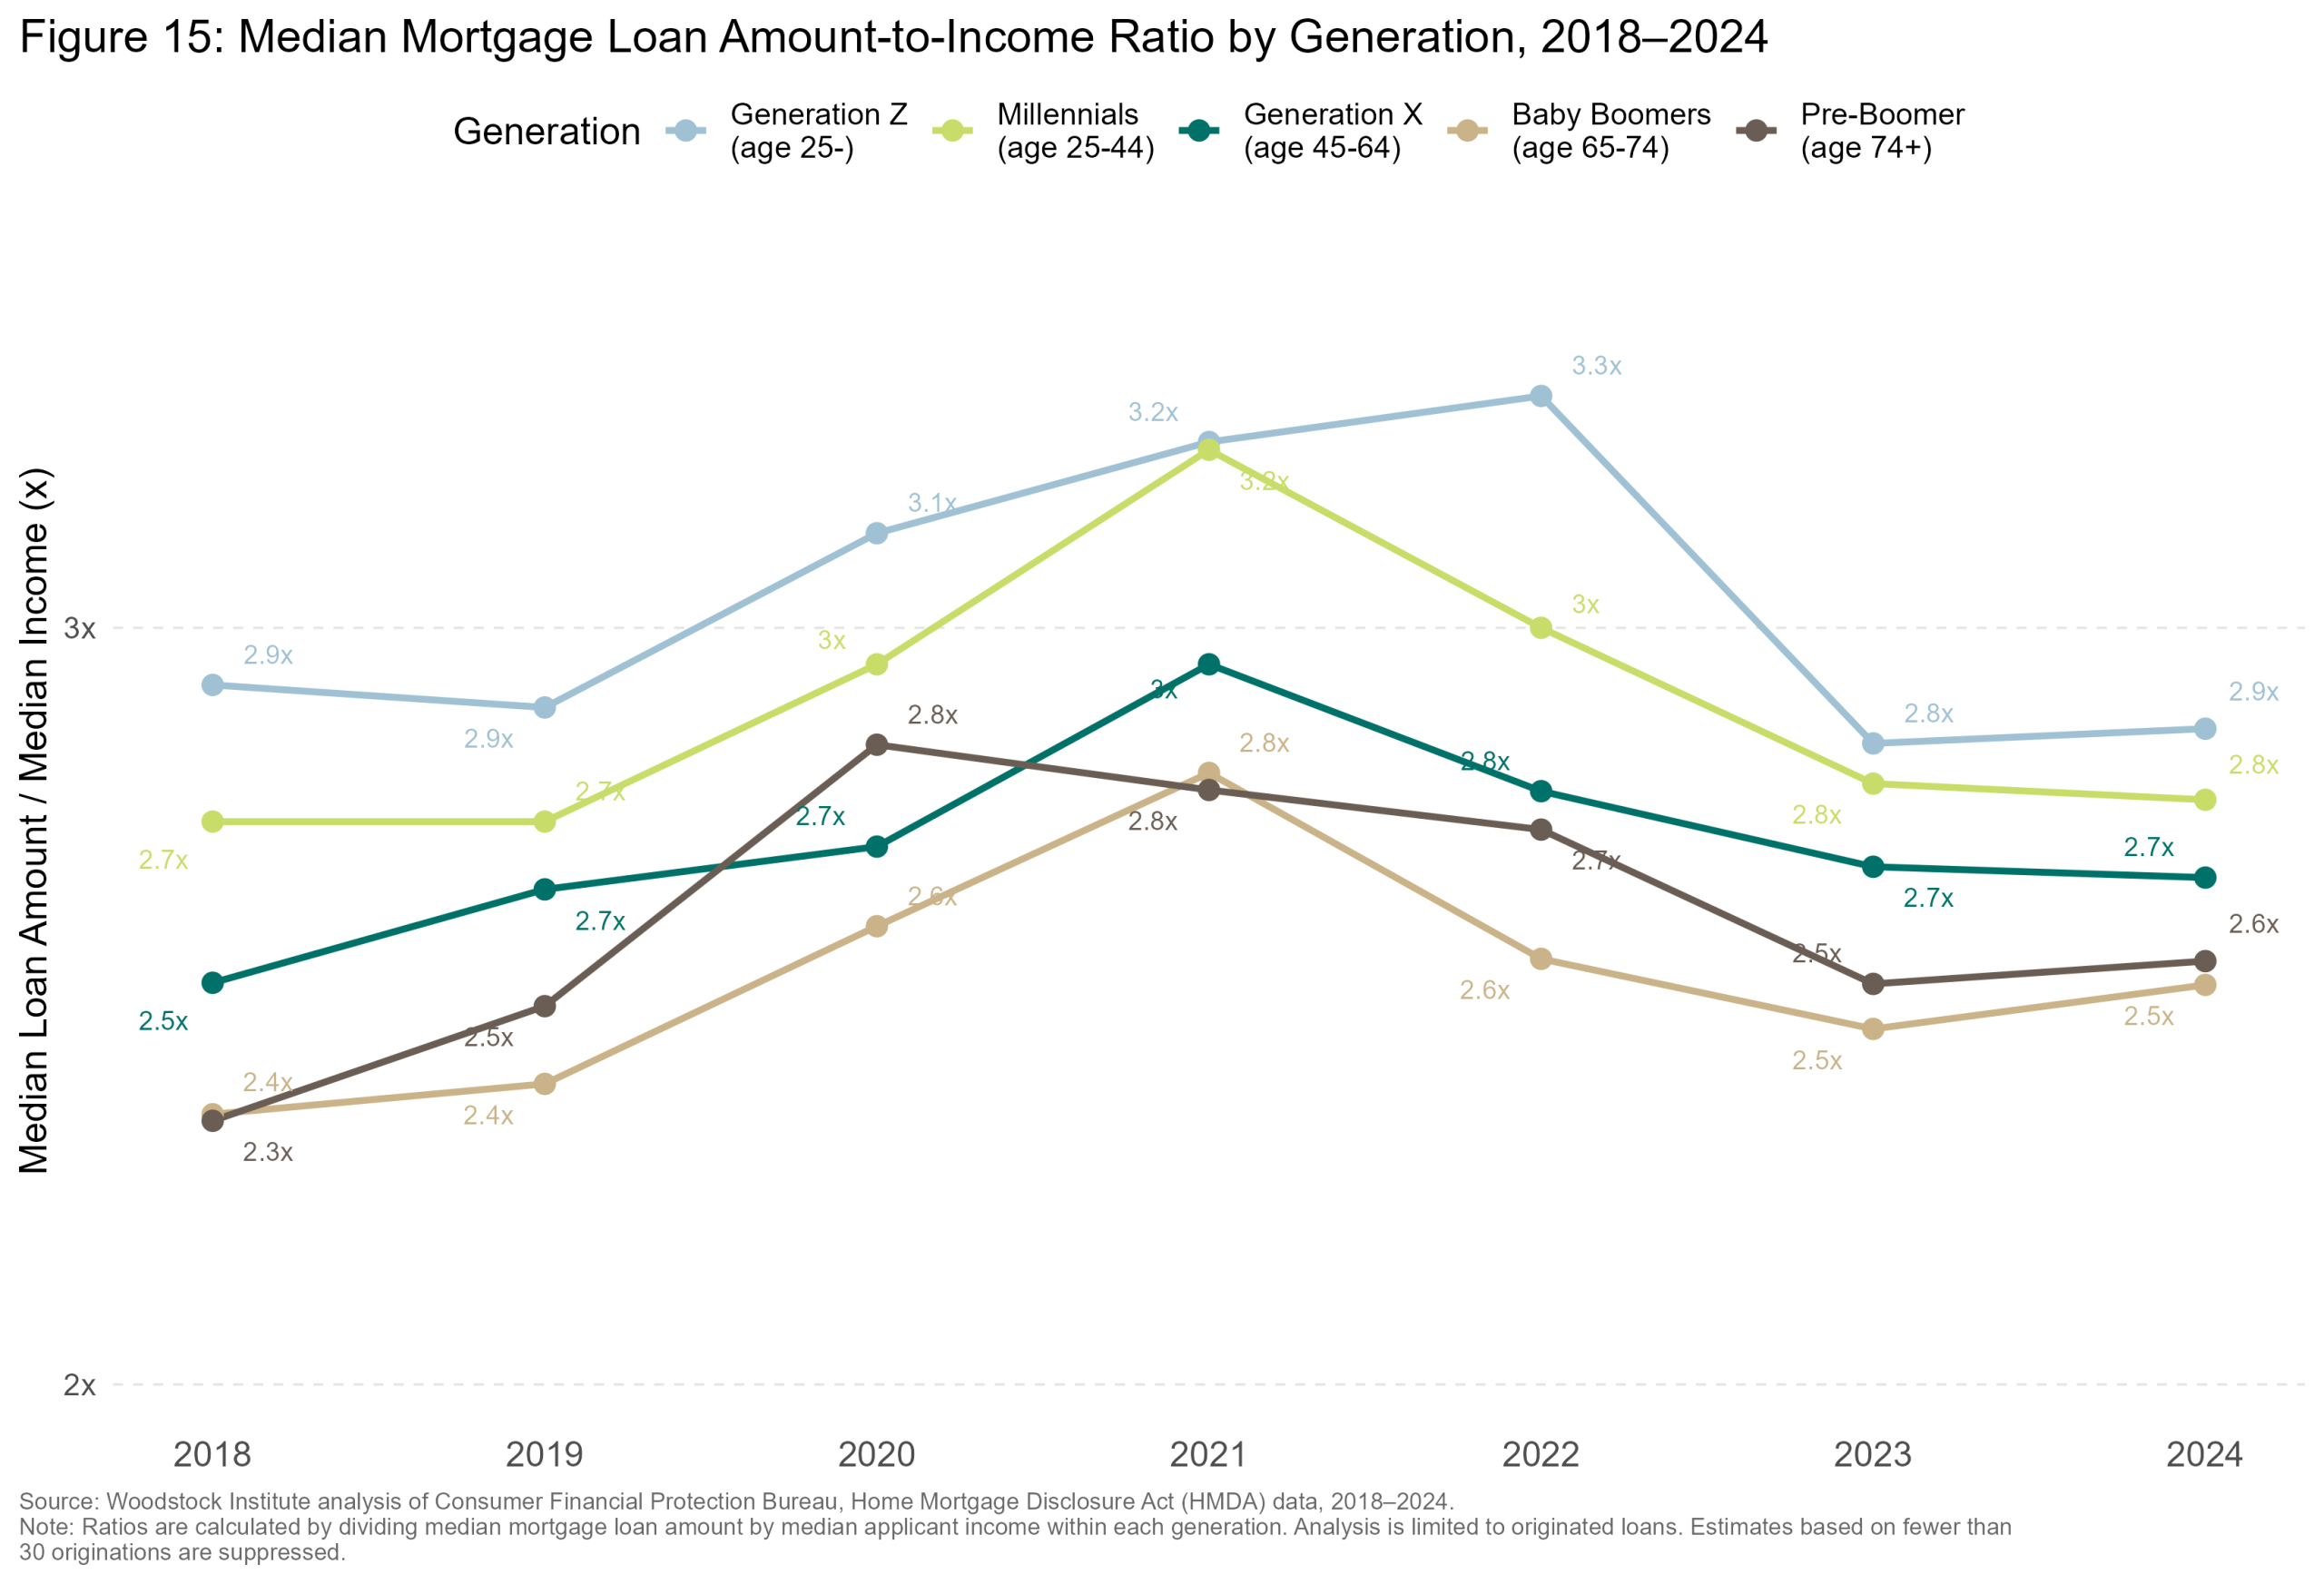
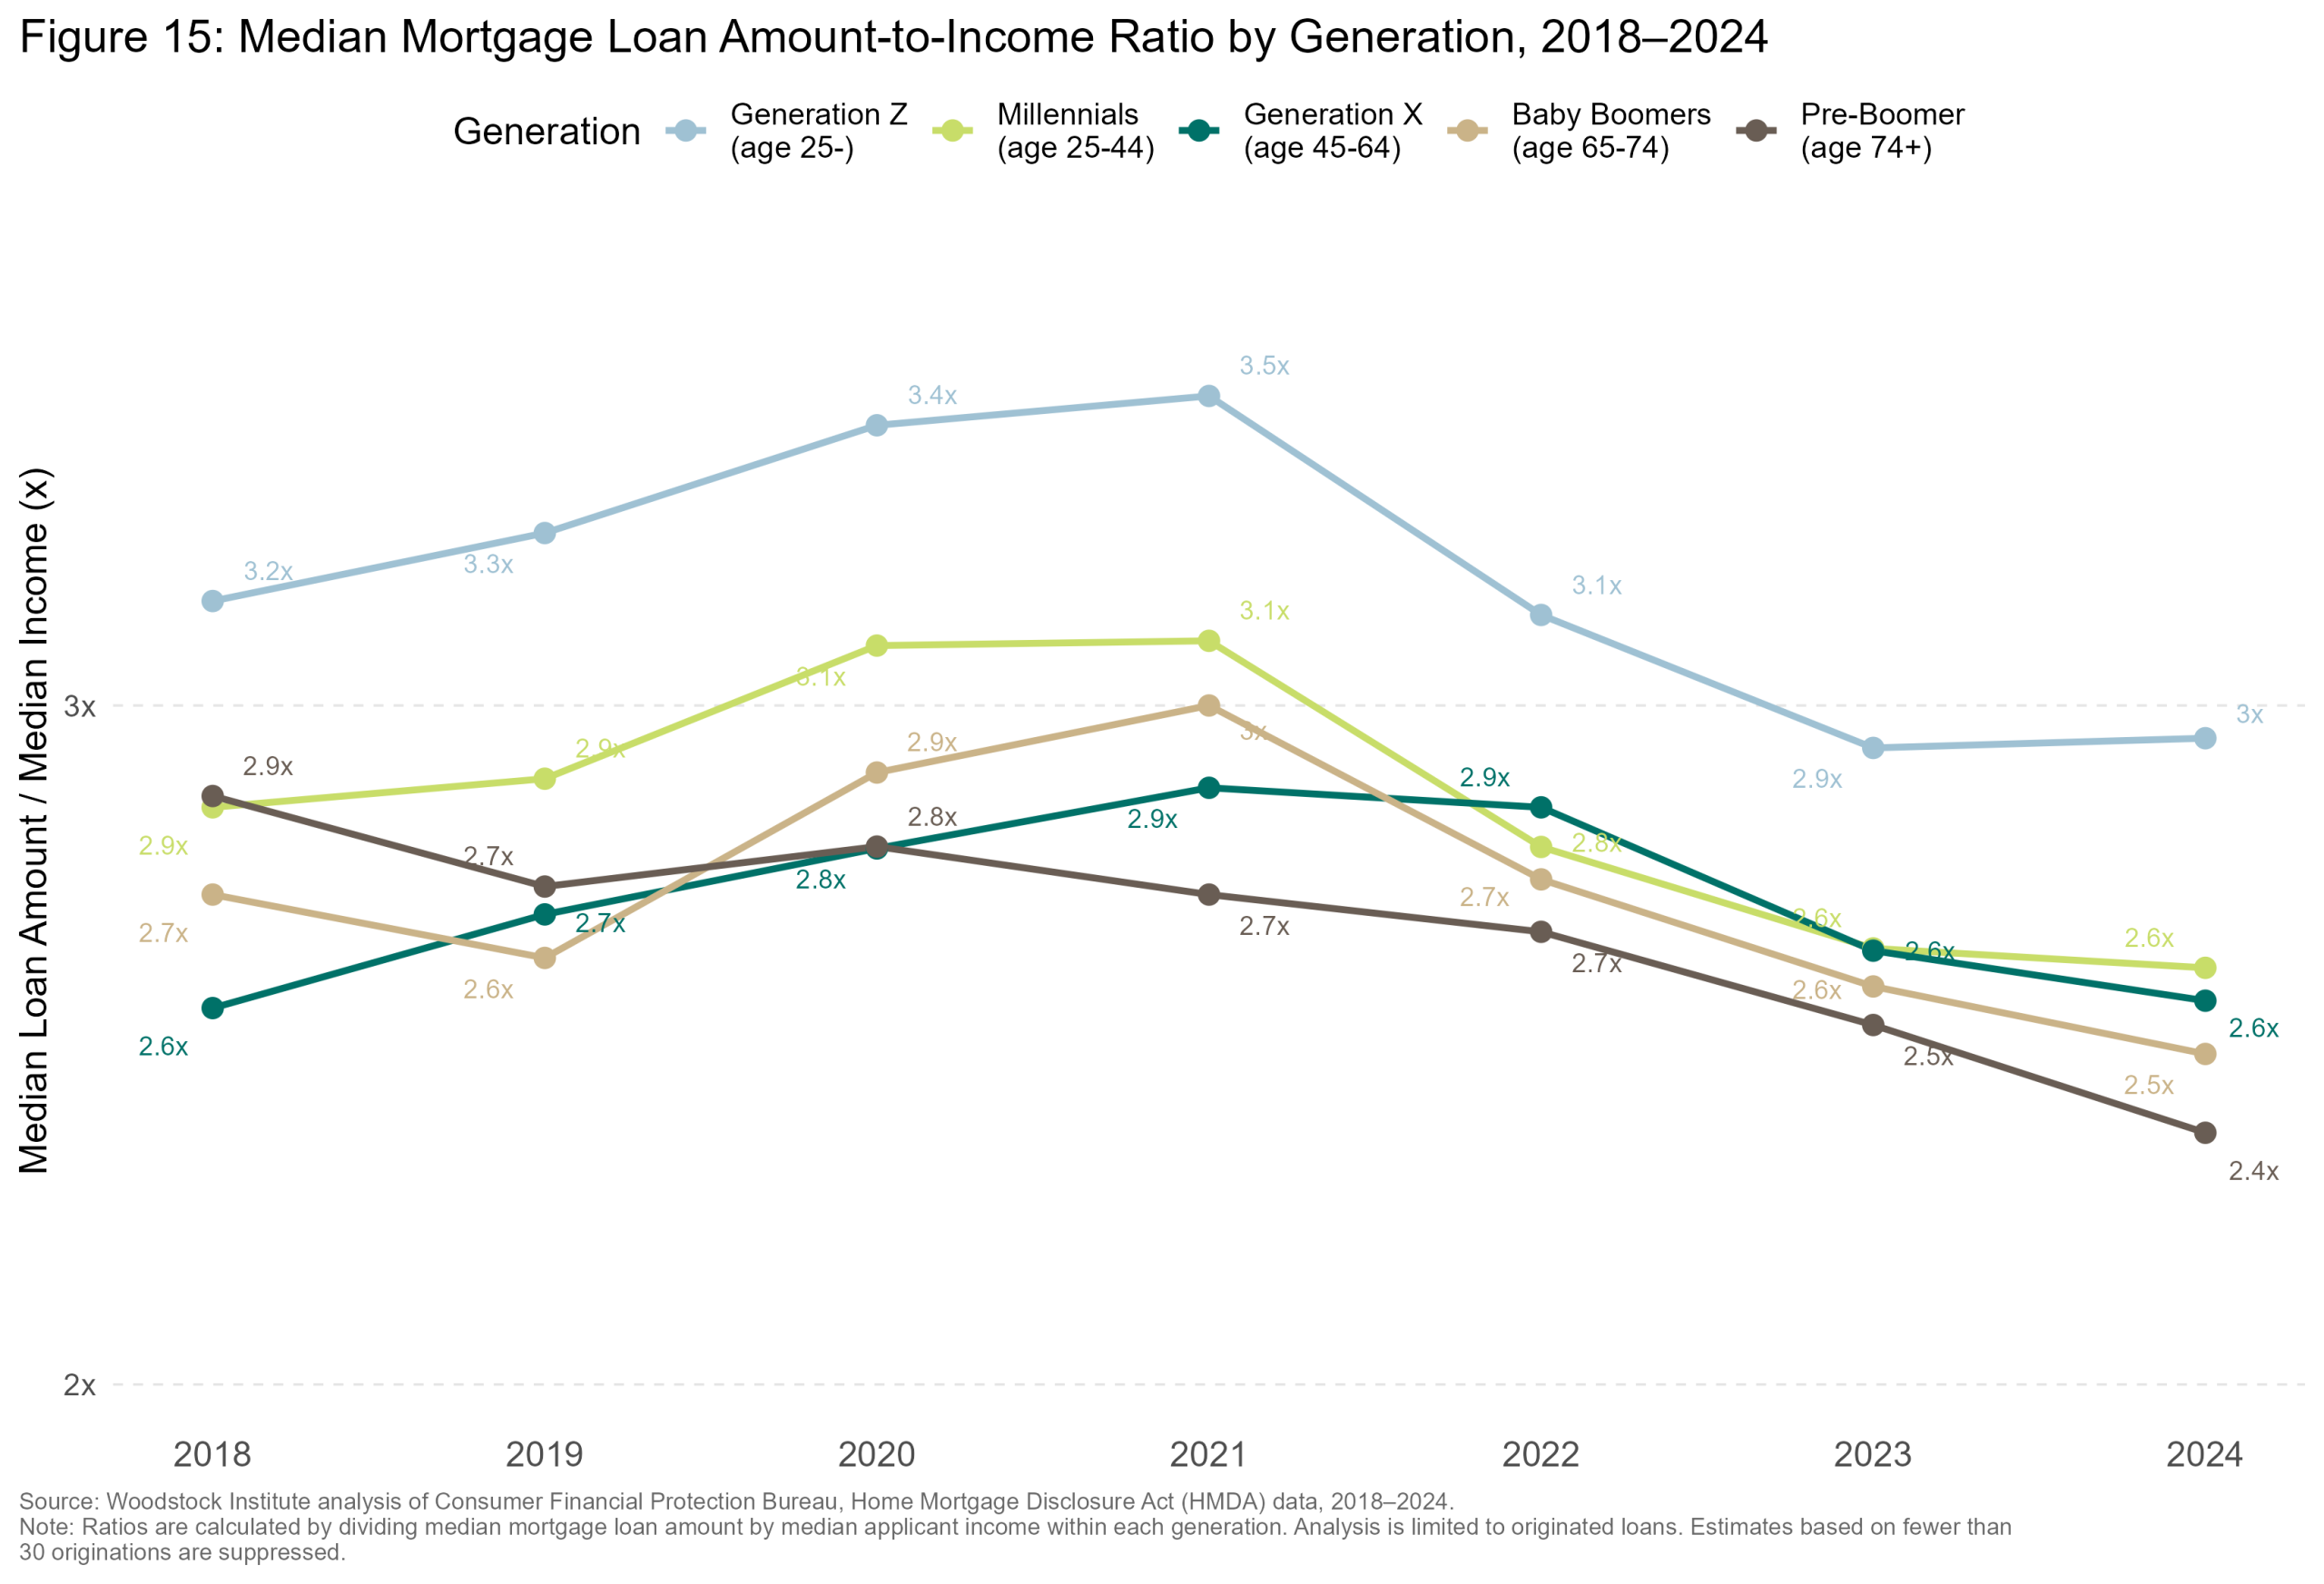
The median millennial loan-to-income ratio (median loan amount divided by median income), calculated year by year, climbed from 2.5x in 2018 to a peak of 3x in 2021, during the COVID-19 pandemic, before declining to 2.6x by 2024 amid higher interest rates and affordability pressures. This means that the loan amount is approximately 2.6x the borrower’s annual income, indicating the amount of mortgage debt relative to earnings. In the six collar counties and suburban Cook County, older generations consistently have less housing affordability pressure than millennial and Generation Z borrowers. Chicago millennial borrowers’ loan-to-income ratio peaked even higher, to 3.1x, in 2021, but has recently become comparable to older generations. This shows that affordability pressures impact all generations in Chicago to some degree. Interestingly enough, Generation Z (those under 25) have even higher affordability pressures in Chicago, likely due to lower incomes and representing a small share of total applicants. Generation X and older had lower ratios than millennials in every geography, although the gap in Chicago was small. (Figure 15)
loan_to_income_ratio_Illinois.png / .jpg / .jpegCheck the file exists in the graphs folder and that this HTML is opened from a browser with local file access enabled.
loan_to_income_ratio_Six_Collar_County.png / .jpg / .jpegCheck the file exists in the graphs folder and that this HTML is opened from a browser with local file access enabled.
loan_to_income_ratio_Suburban_Cook.png / .jpg / .jpegCheck the file exists in the graphs folder and that this HTML is opened from a browser with local file access enabled.
loan_to_income_ratio_Chicago.png / .jpg / .jpegCheck the file exists in the graphs folder and that this HTML is opened from a browser with local file access enabled.
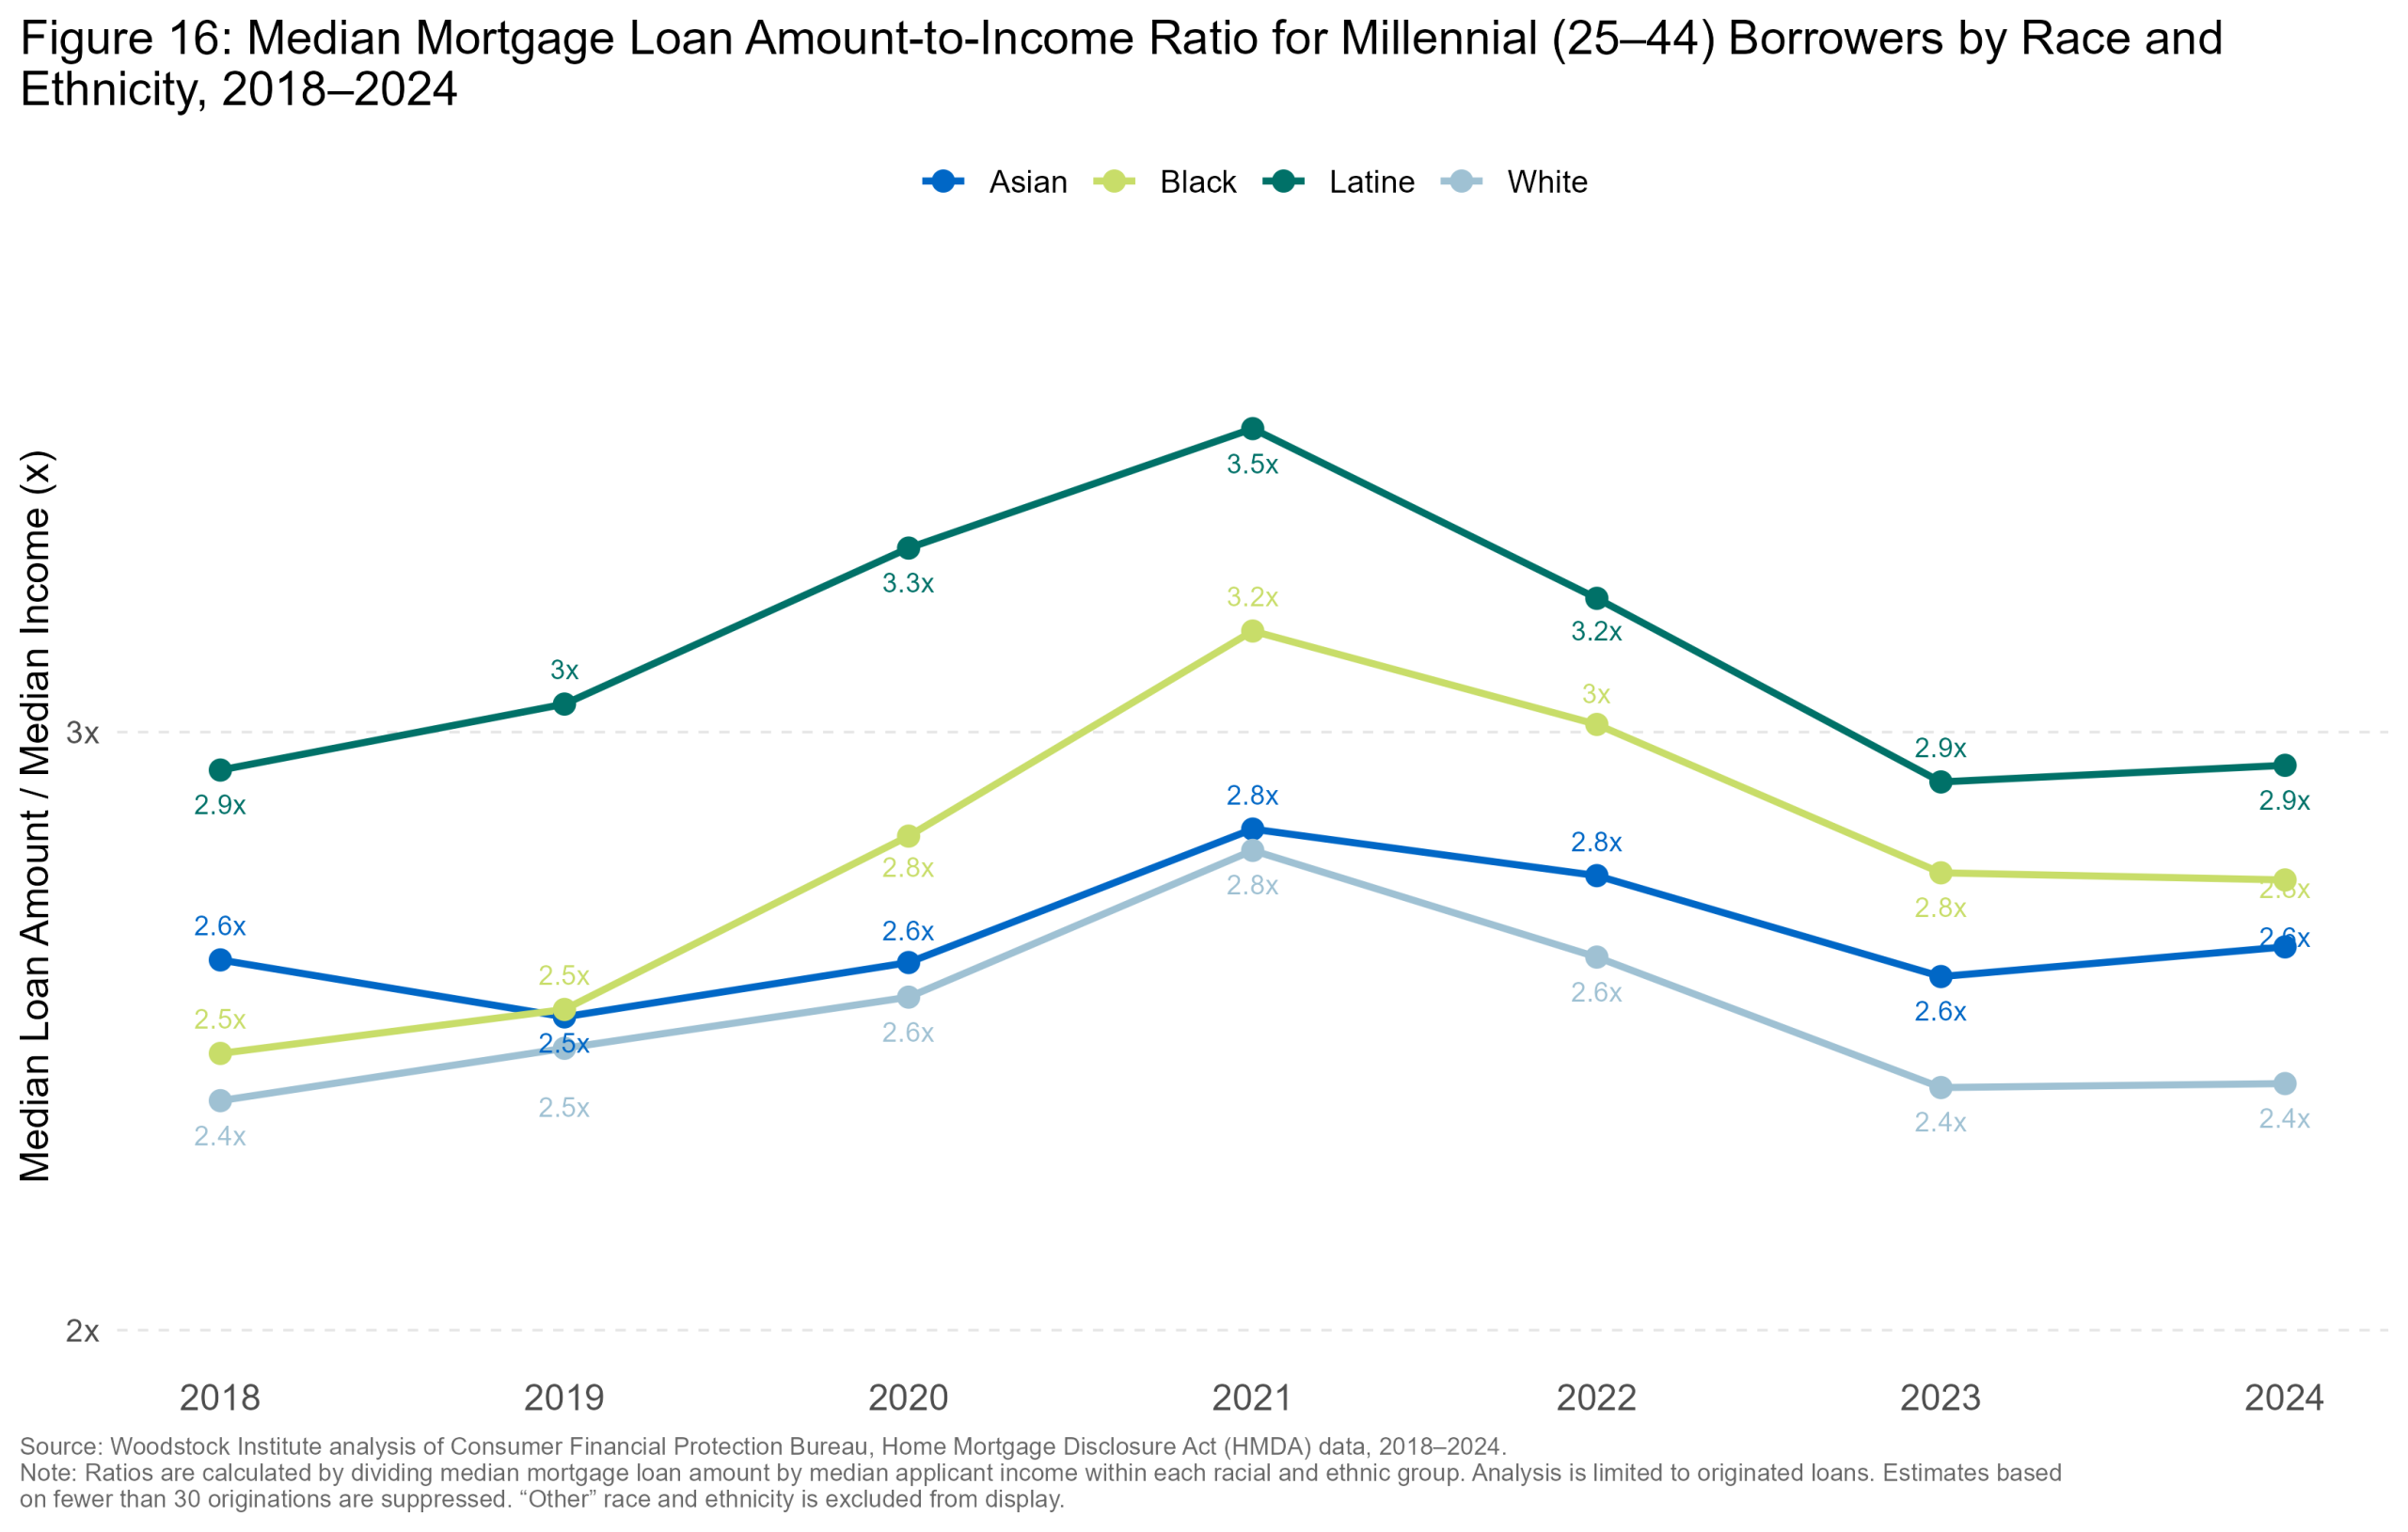
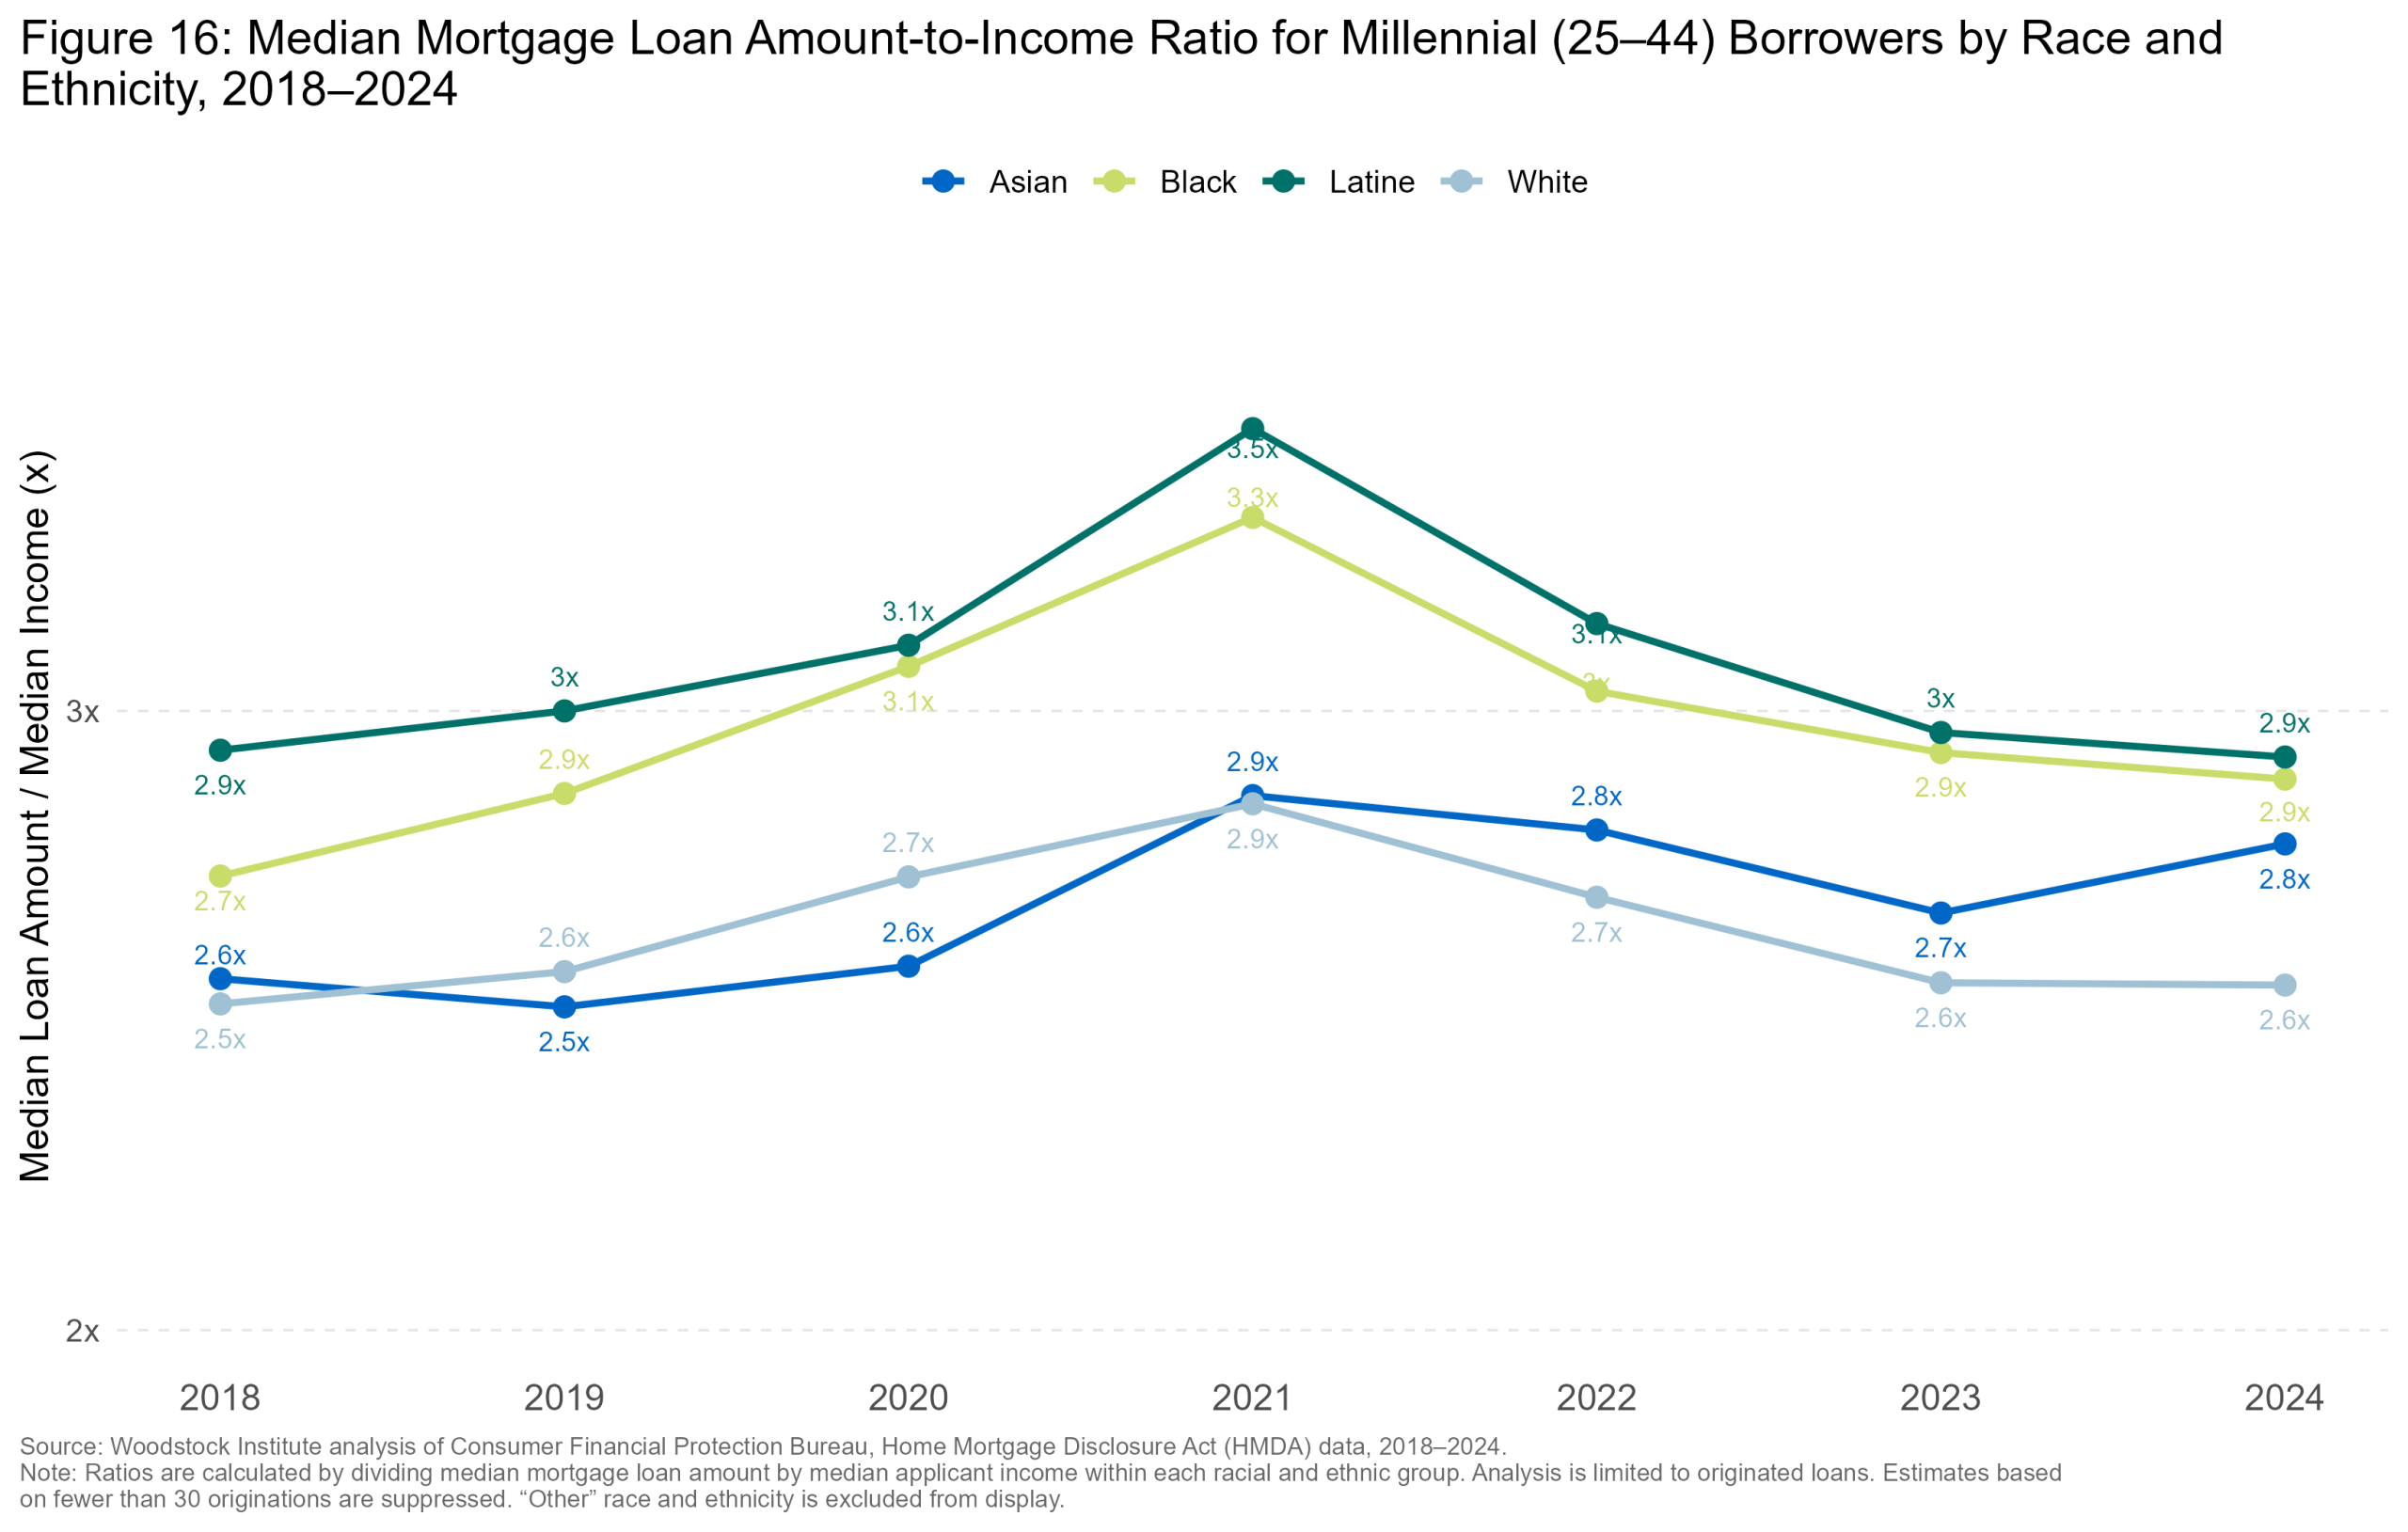
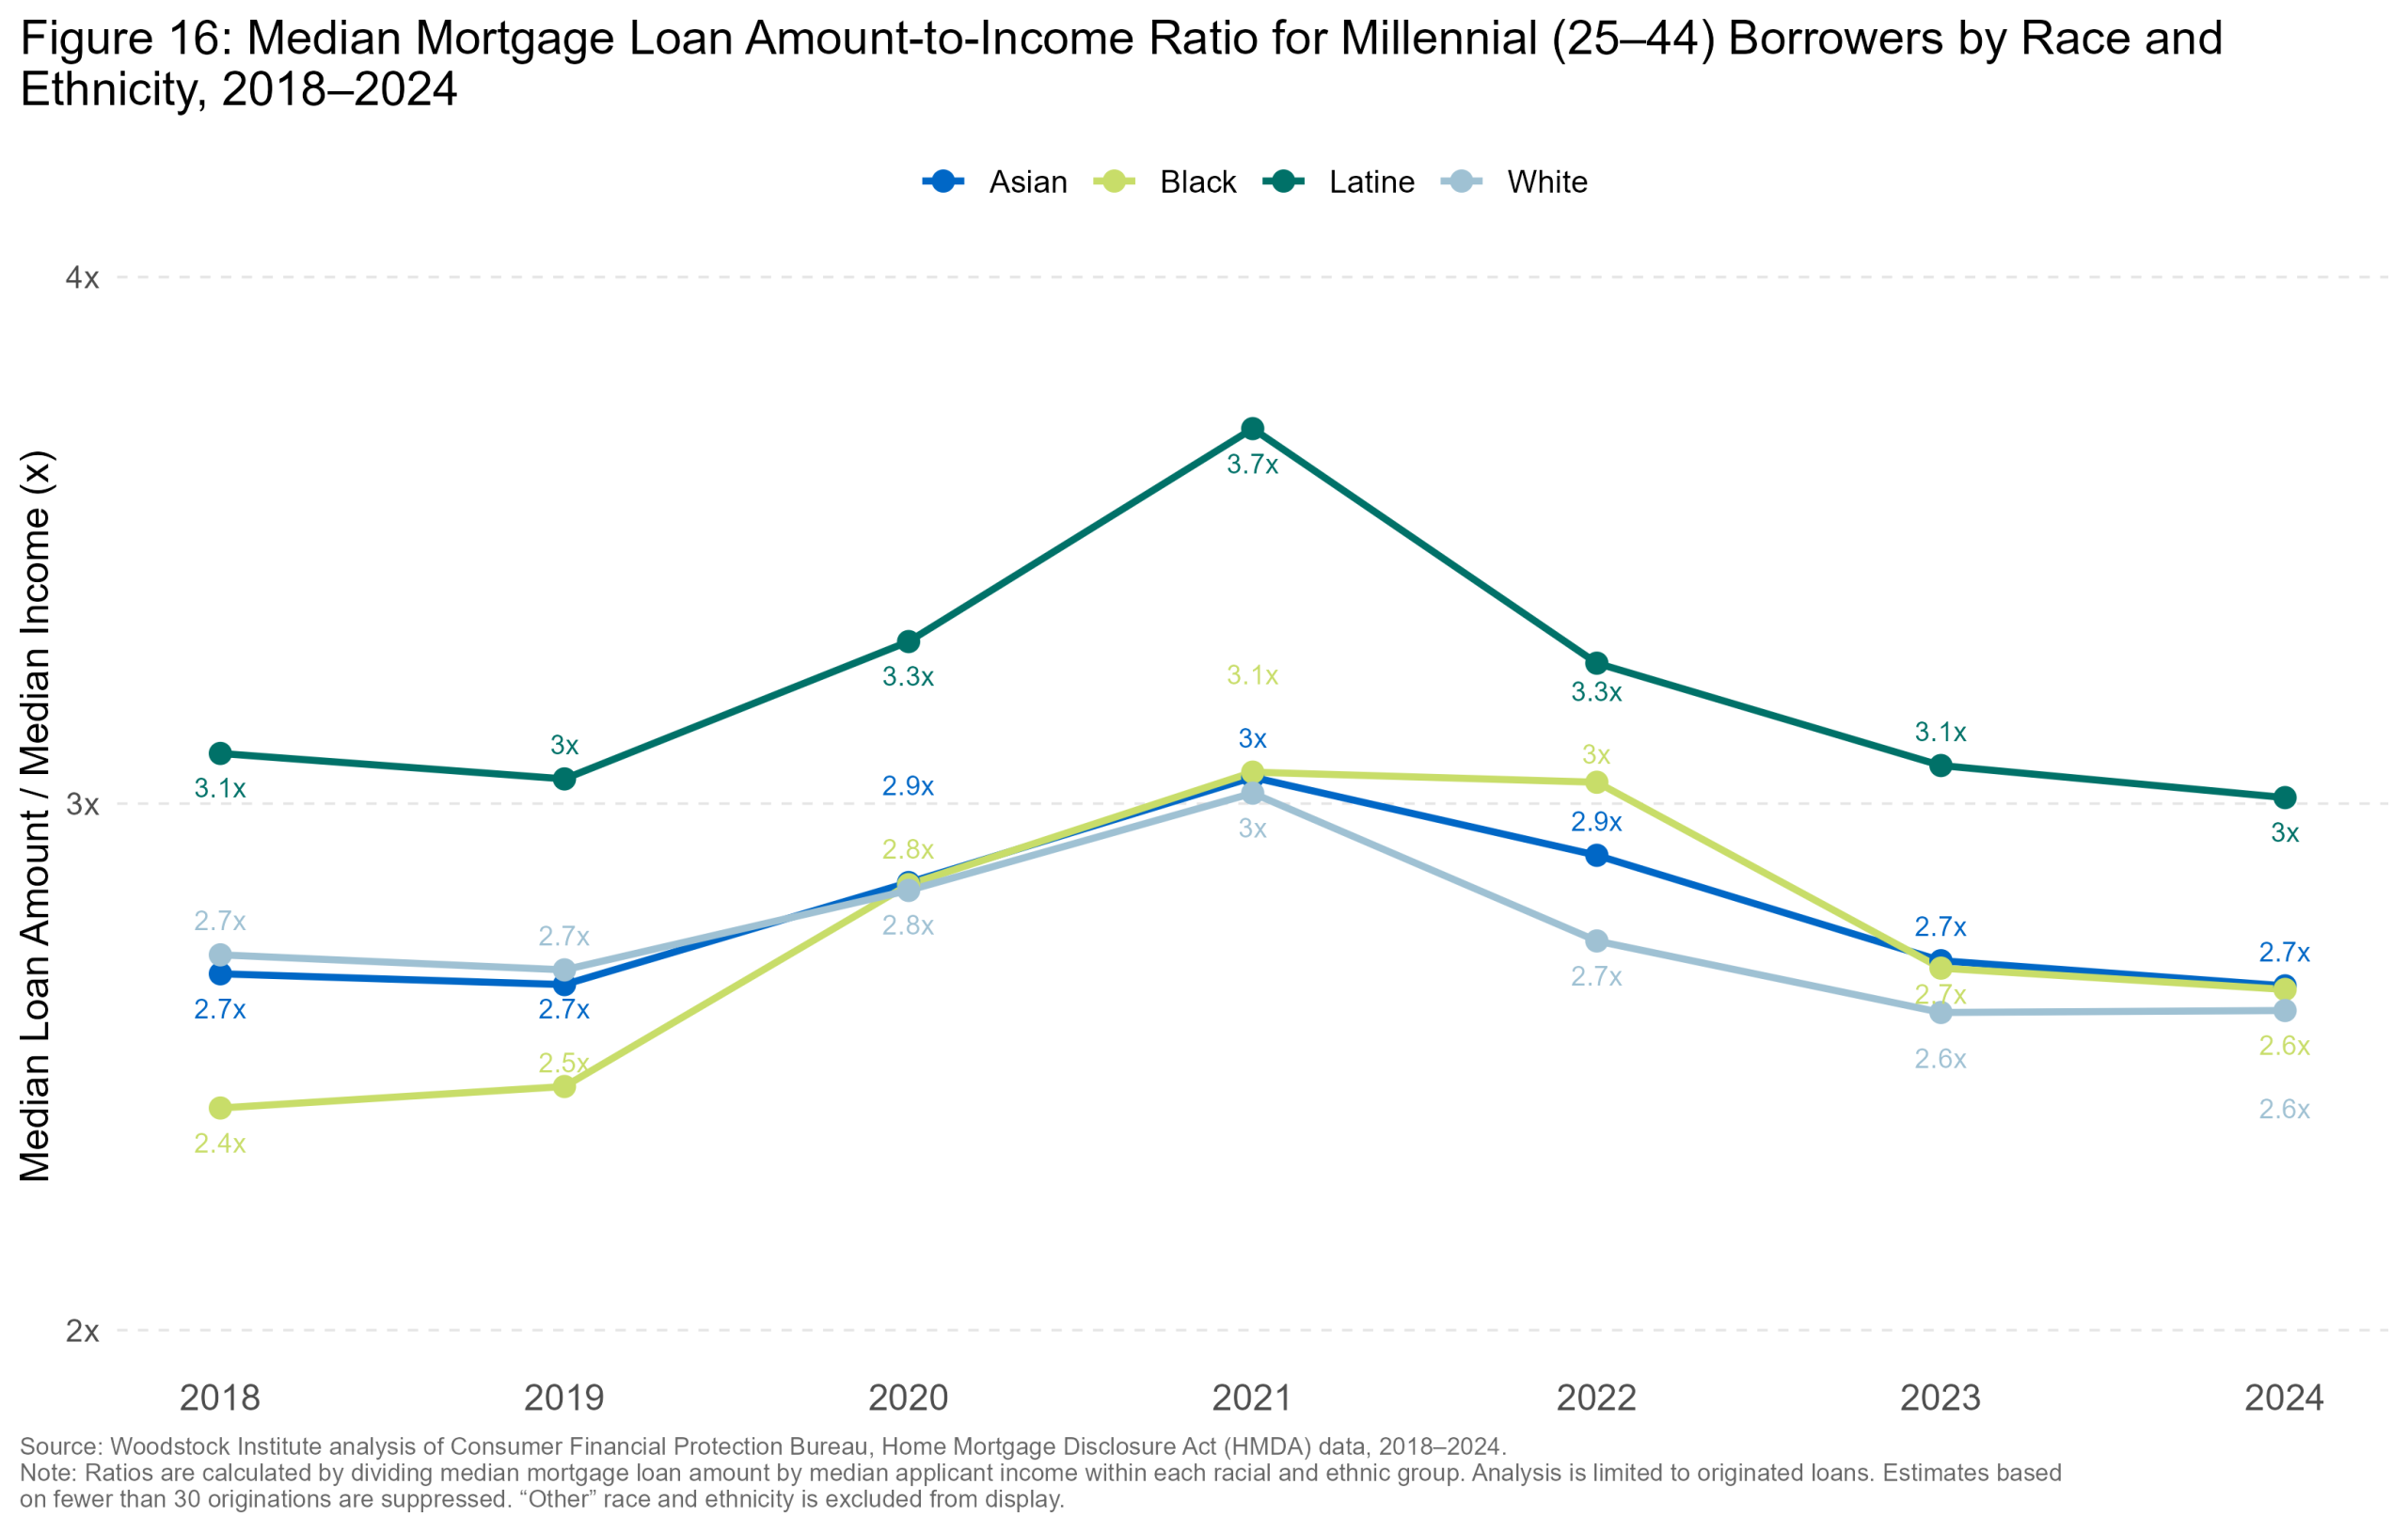
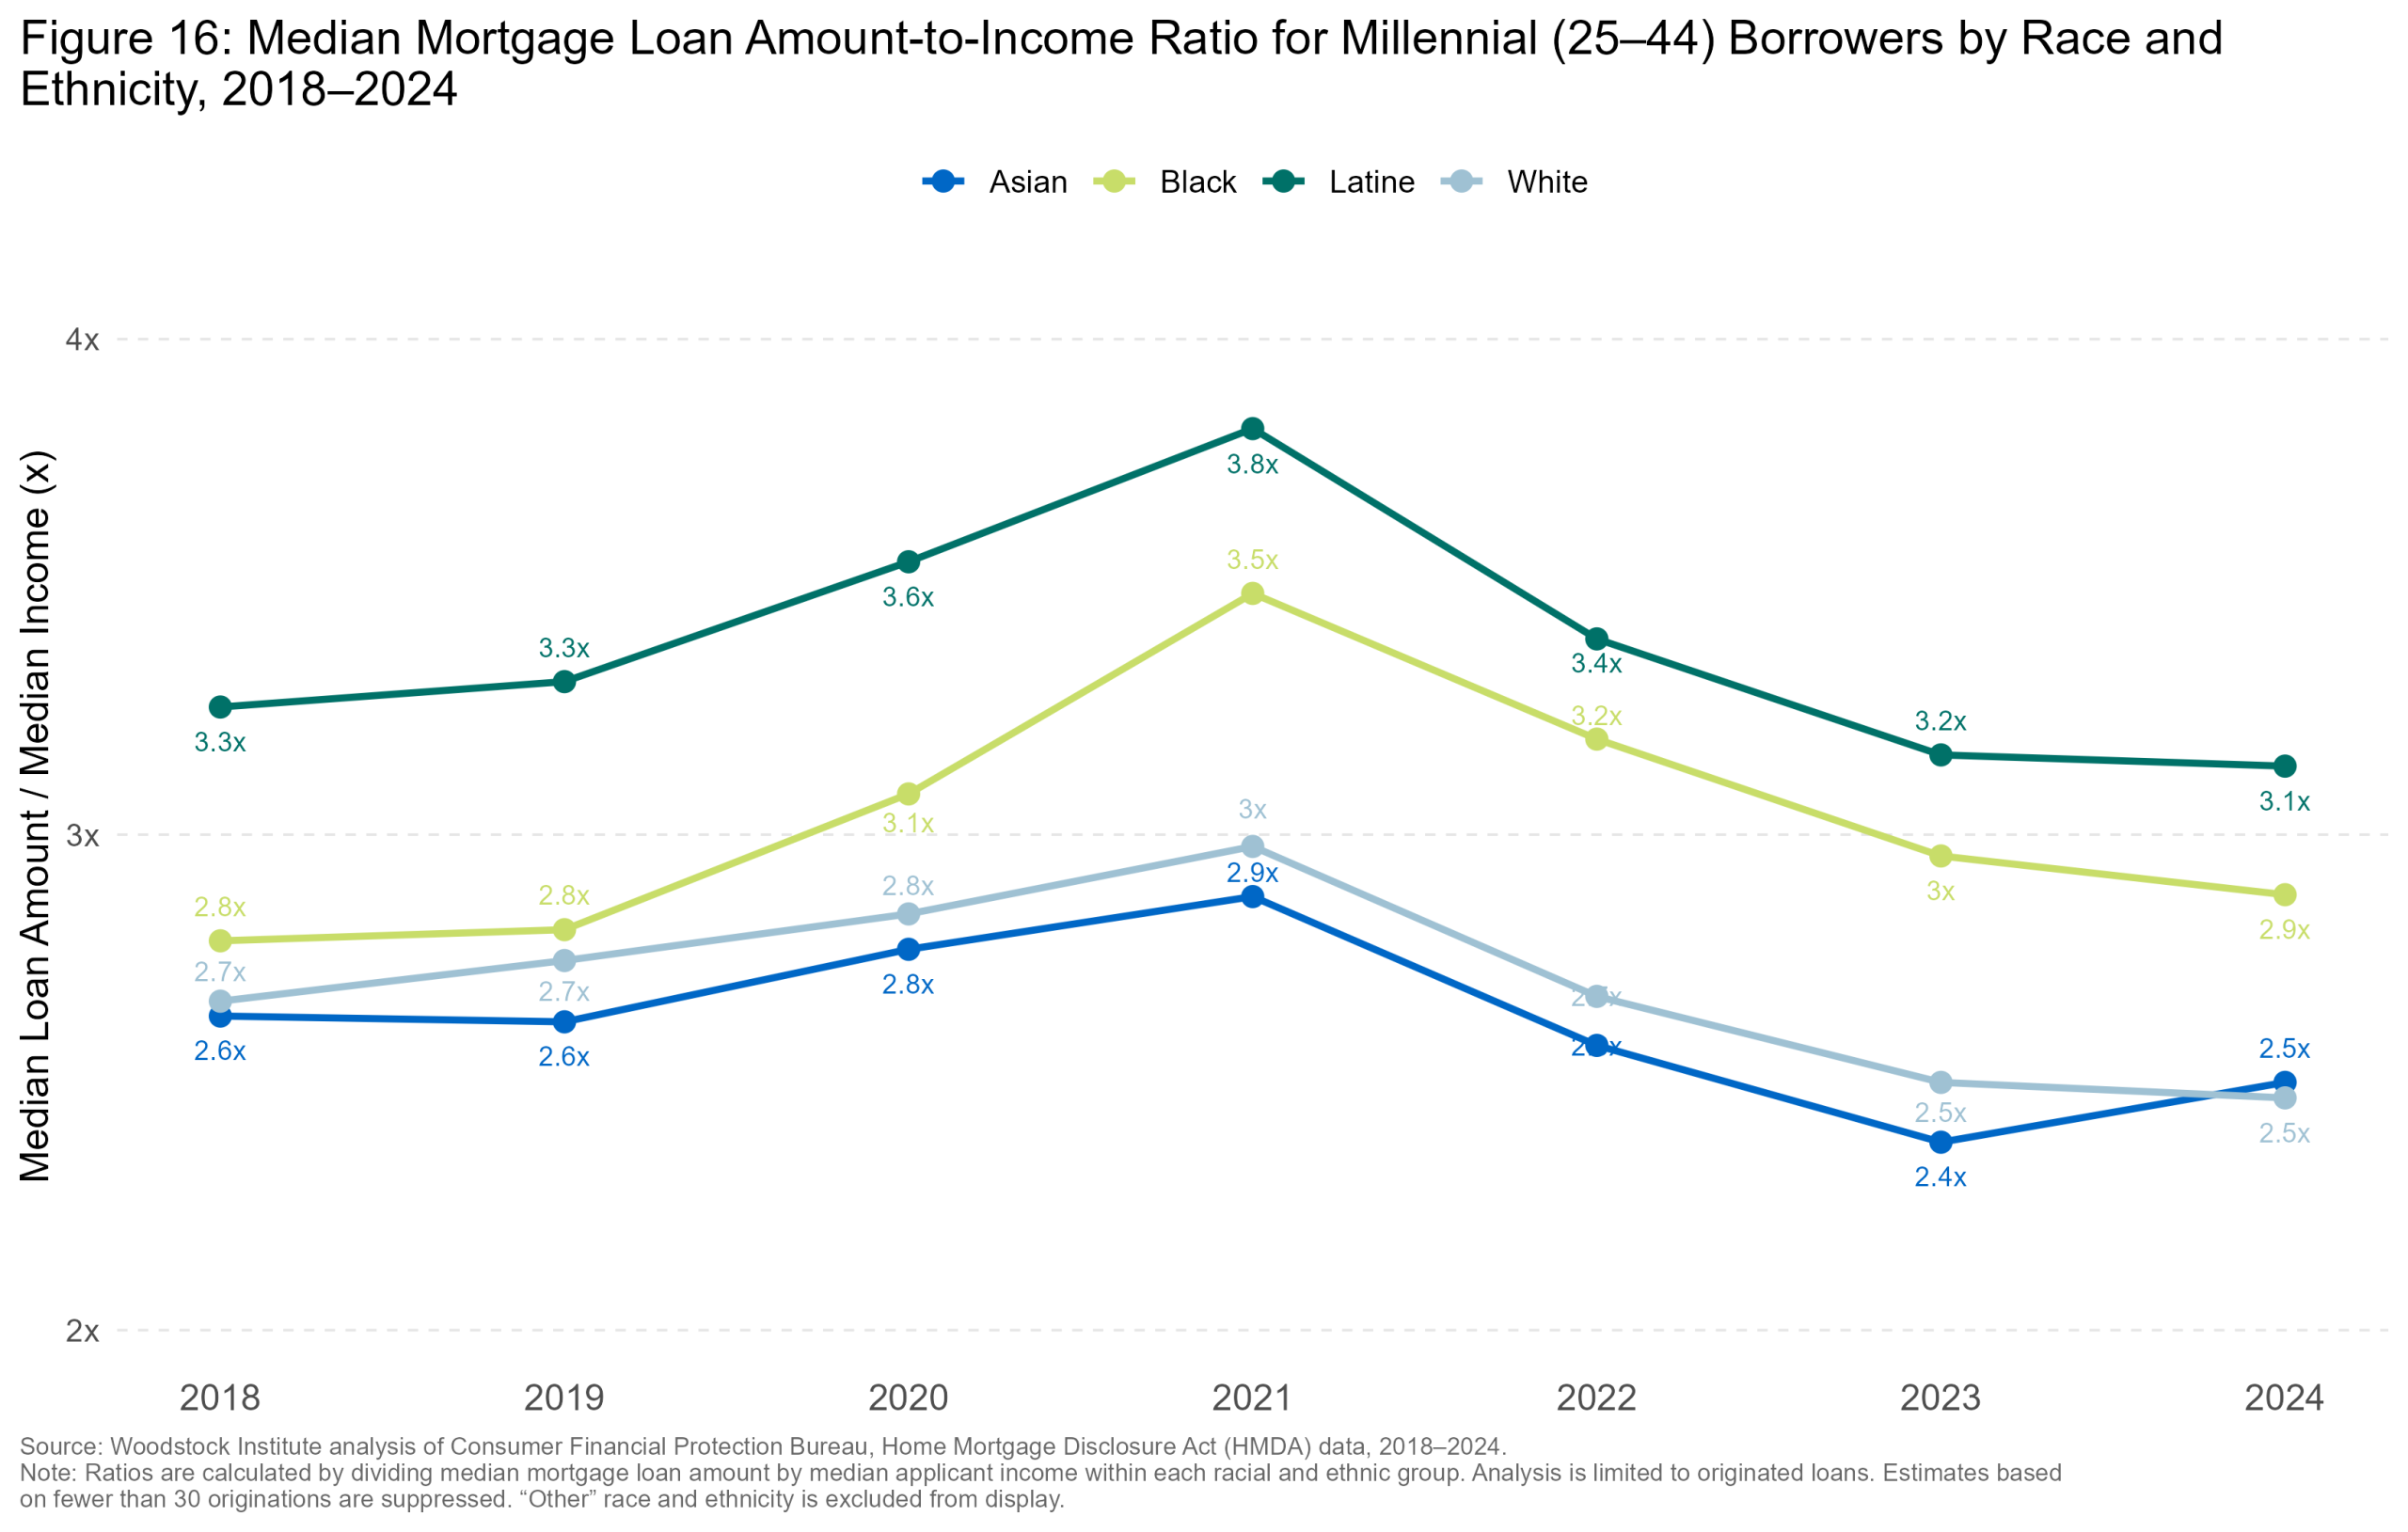
Among millennials, Latine and Black applicants face greater affordability pressures across Illinois, aligning with the lower income and higher debt findings. Across all geographies, Latine borrowers faced the greatest affordability pressures, consistently exhibiting the highest loan-to-income ratio, rising from 2.9x to a peak of 3.5x in 2021, before declining back to 2.9x in 2024. Suburban Cook County and Chicago had the greatest affordability pressure for Latine borrowers, with the ratio of median loan amount to median income peaking at 3.7x and 3.8x, respectively, in 2021. Black borrowers had the second highest affordability pressures, statewide, but started lower than Asian and Latine borrowers with loans 2.5x their income in 2018, climbing to 3.2x in 2021, and settling at 2.8x in 2024. White borrowers had the lowest affordability pressure consistently across Illinois with Asian borrowers close behind. Chicago had a similar disparity pattern as the state but with greater affordability pressure for most groups. The six collar counties had a narrower gap between Black and Latine borrowers, but affordability pressure persisted. Suburban Cook County had much smaller disparities between Black, Asian and White borrowers. (Figure 16)
plot_lti_mill_race_Illinois.png / .jpg / .jpegCheck the file exists in the graphs folder and that this HTML is opened from a browser with local file access enabled.
plot_lti_mill_race_Six_Collar_County.png / .jpg / .jpegCheck the file exists in the graphs folder and that this HTML is opened from a browser with local file access enabled.
plot_lti_mill_race_Suburban_Cook.png / .jpg / .jpegCheck the file exists in the graphs folder and that this HTML is opened from a browser with local file access enabled.
plot_lti_mill_race_Chicago.png / .jpg / .jpegCheck the file exists in the graphs folder and that this HTML is opened from a browser with local file access enabled.
Black and Latine millennials are often financing lower-cost properties while committing a greater share of their income, entering the transaction with less equity, potentially impacting their long-term financial capacity after closing. If there is a market downturn, loss of income, or an unexpected expense, limited financial capacity and lower cash reserves can create a higher risk of foreclosure. The next section turns to what borrowers pay to close on these loans, including origination costs and other expenses related to the lender, and third-party services, both fixed and variable.
Median loan costs
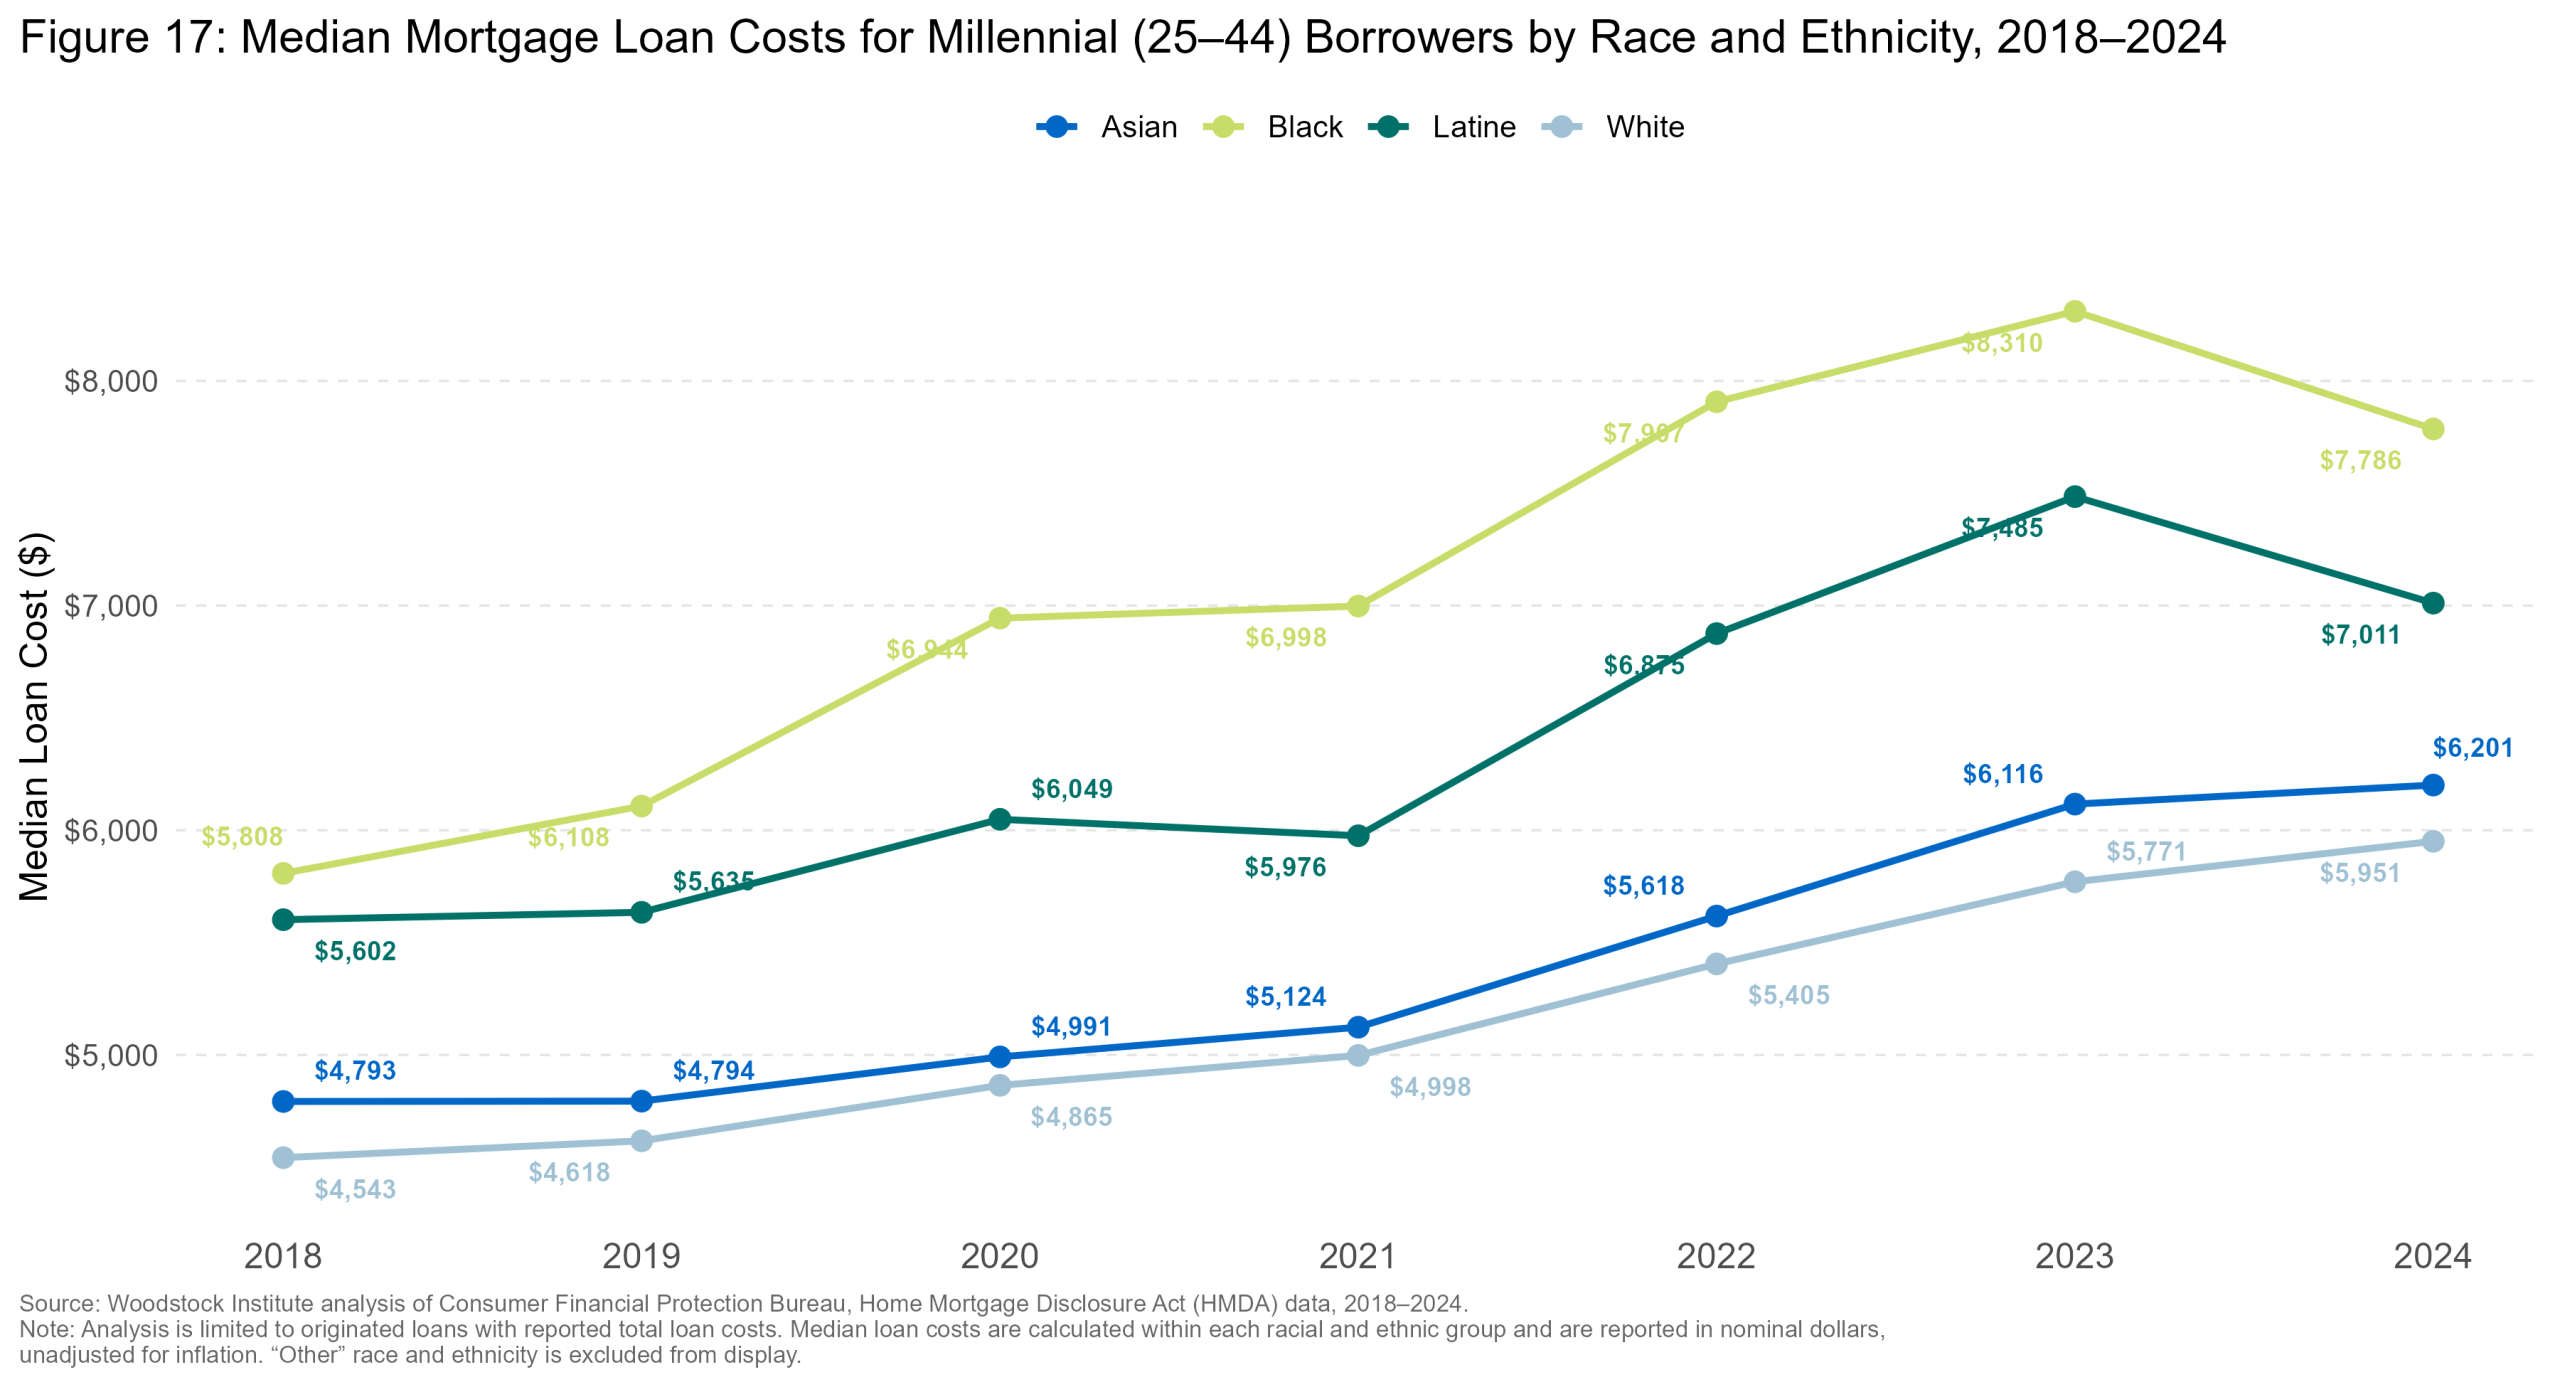
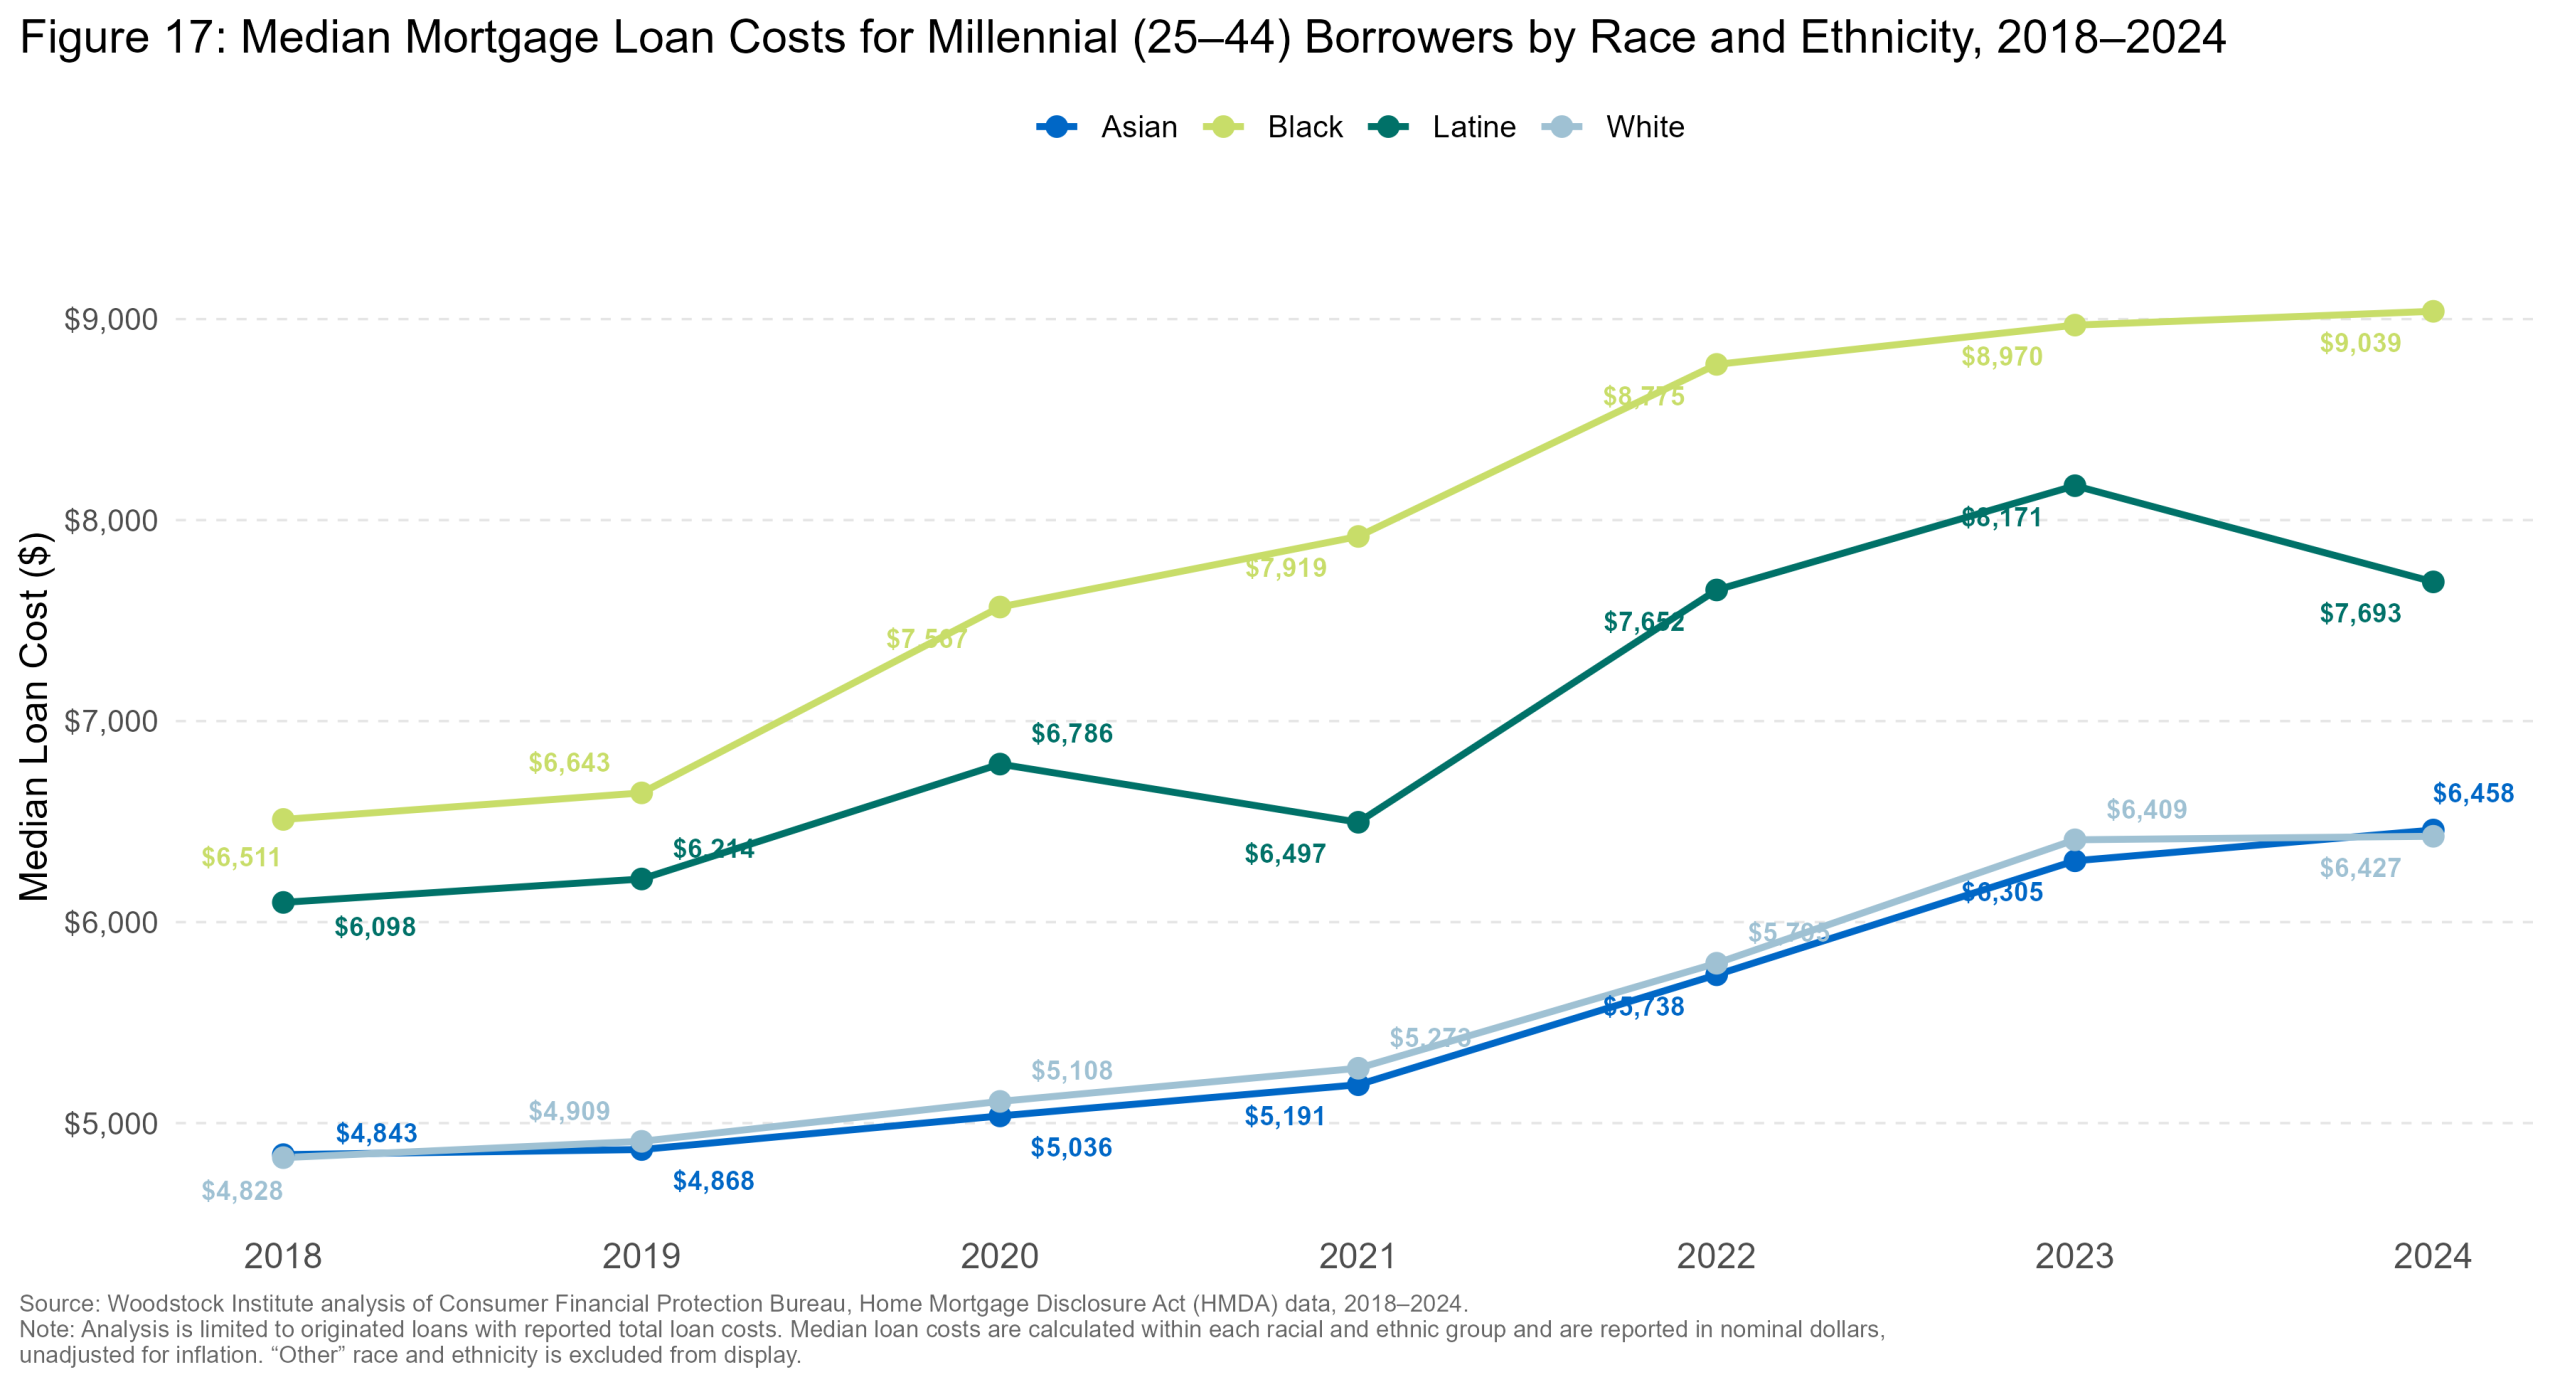
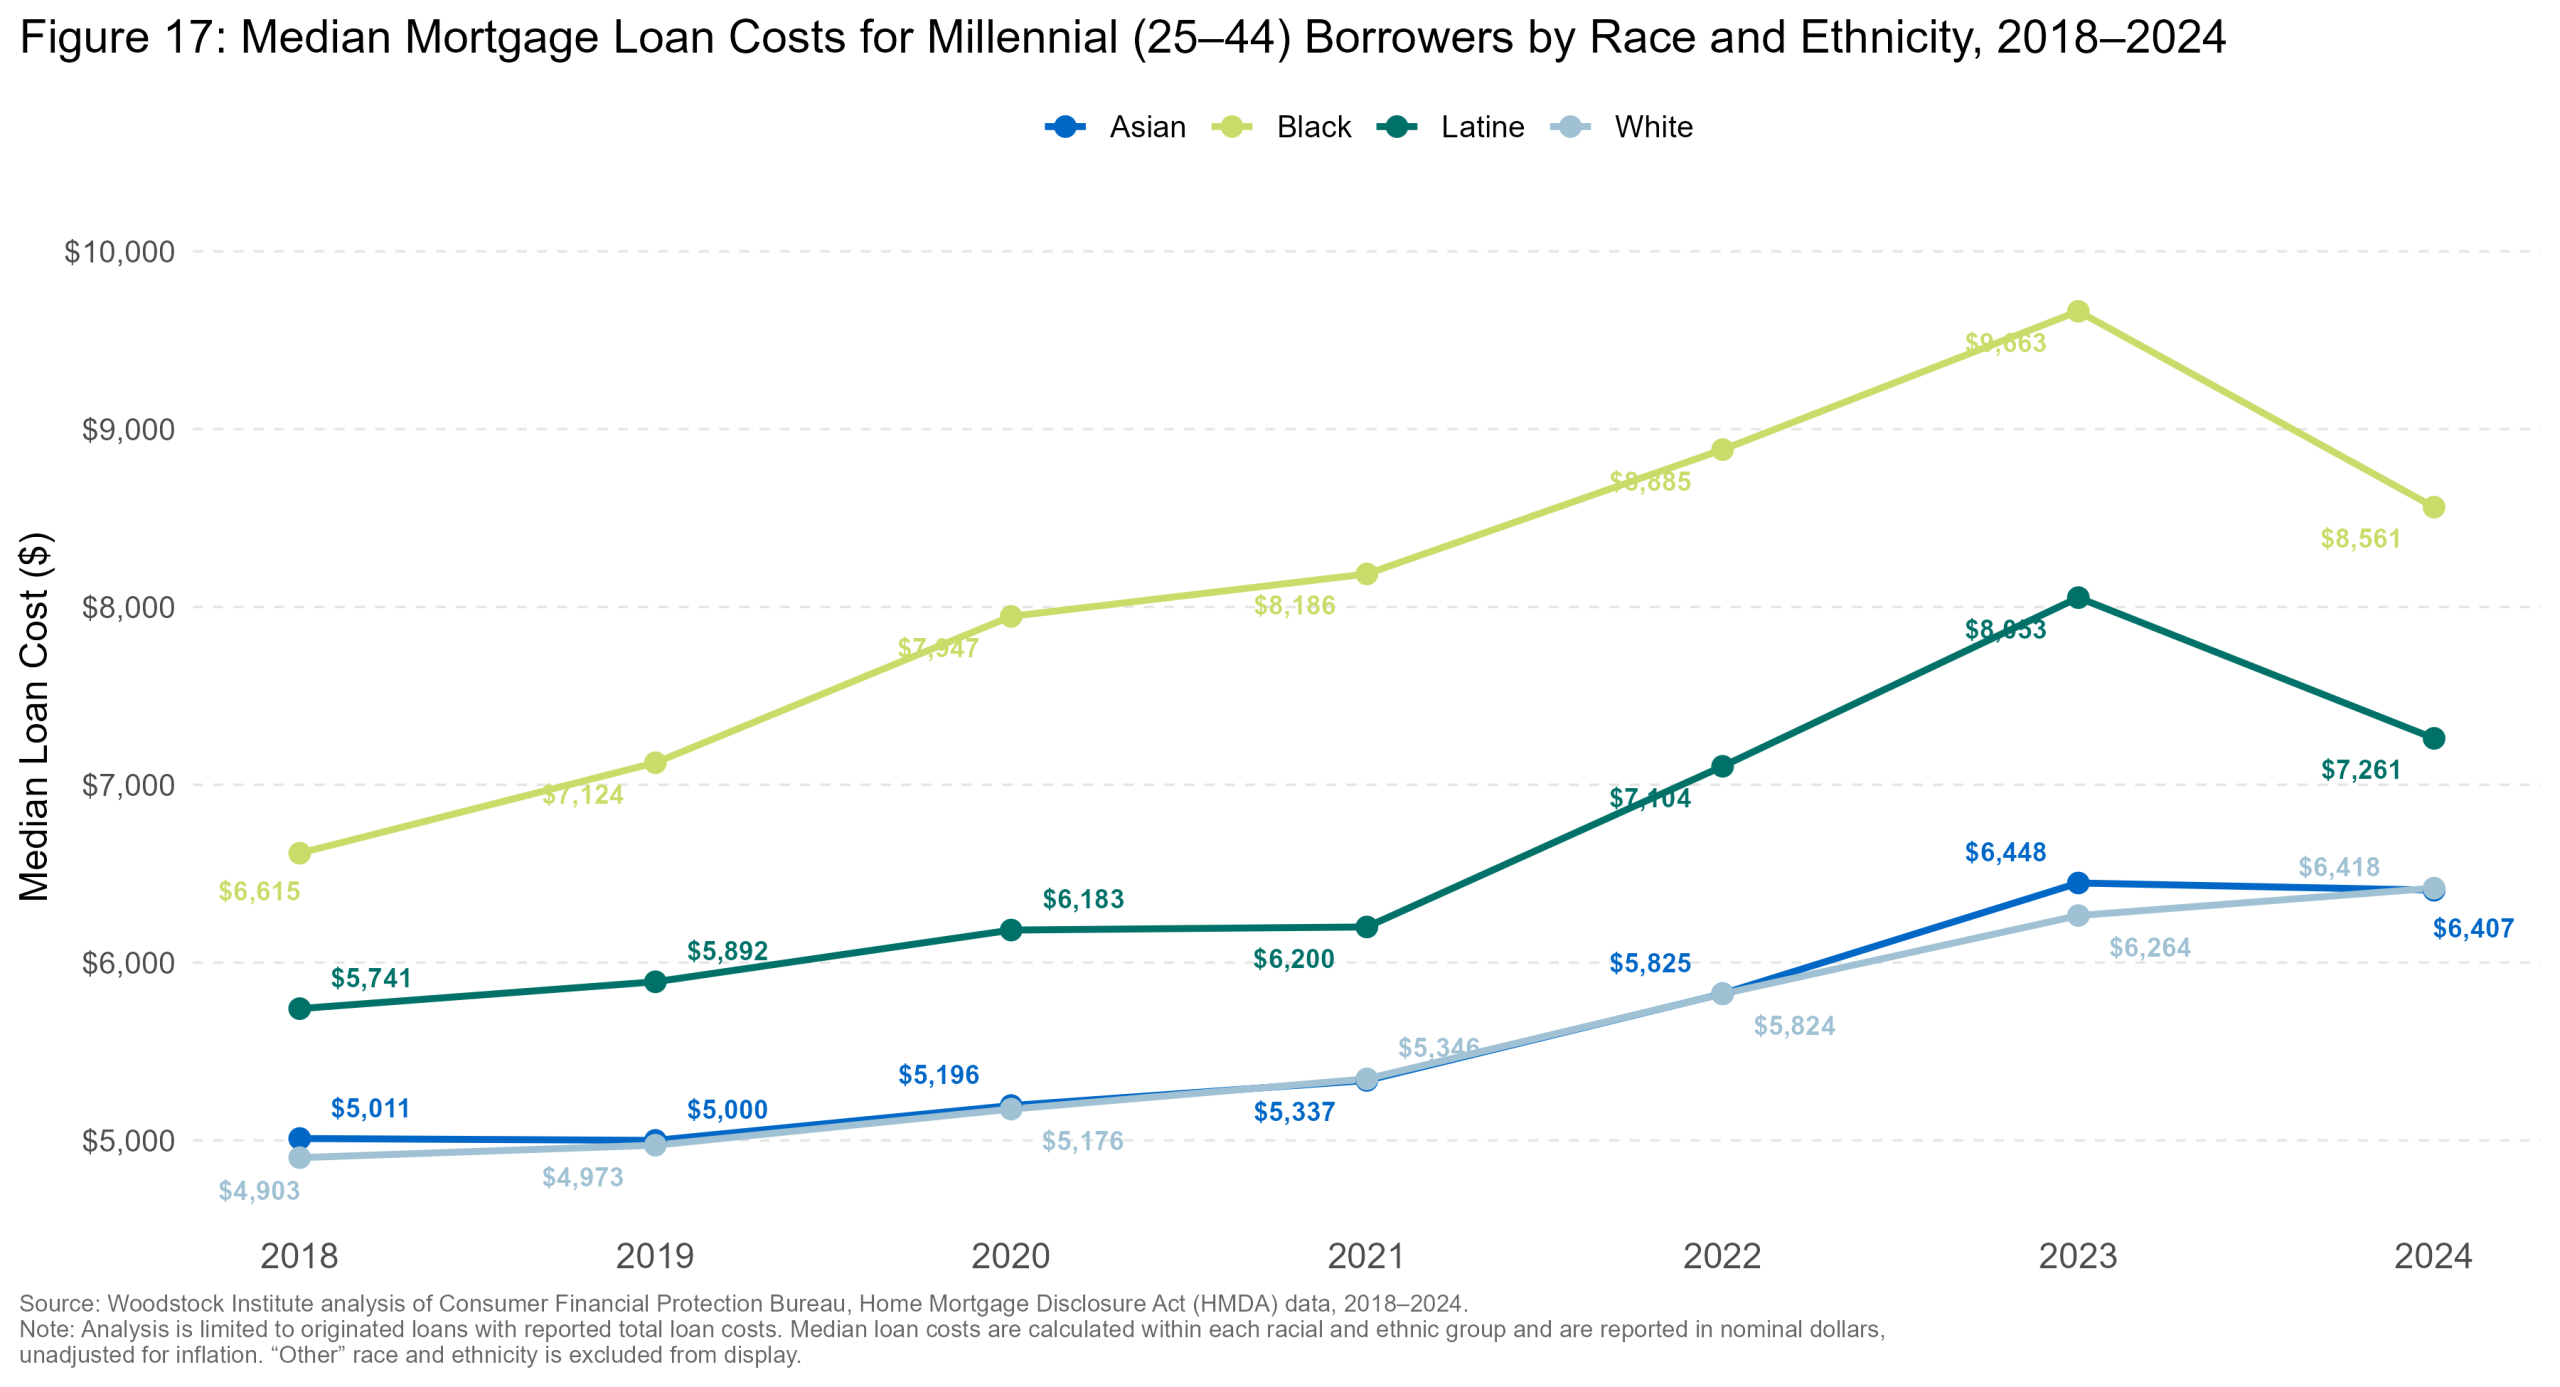
The costs of obtaining a loan create yet another barrier to closing on a mortgage and could further contribute to financial fragility among borrowers entering homeownership with limited reserves. Median loan costs, including underwriting fees, origination fees, processing fees, and other bank-related expenses, are only some of the expenses a borrower can comparison shop for. These costs have risen sharply for all racial groups since 2018. Unsurprisingly, Black and Latine millennial borrowers consistently pay the most, especially in comparison to their loan amounts. In 201826, across Illinois, Black borrowers had a median loan cost of $5,808, peaking at $8,310 in 2023, and falling to $7,786 in 2024. Latine borrowers were close behind ranging from $5,602 in 2018 to $7,011 in 2024. White and Asian borrowers consistently had lower costs during this time period. White borrowers’ median costs rose from $4,543 in 2018 to $5,951 in 2024, and Asian borrowers’ costs ranged from $4,793 to $6,201 during that time. By 2024, Black borrowers paid roughly $1,835 more than White borrowers and $1,585 more than Asian borrowers, for smaller loans with lower property values. Latine borrowers paid over $800 and $1,060 more than Asian and White borrowers, respectively, in median loan costs in Illinois. The costs of loans create yet another barrier to mortgage access, contributing to disparities and potentially creating a financial strain for borrowers after closing. (Figure 17)
loan_cost_by_race_Illinois.png / .jpg / .jpegCheck the file exists in the graphs folder and that this HTML is opened from a browser with local file access enabled.
loan_cost_by_race_Six_Collar_County.png / .jpg / .jpegCheck the file exists in the graphs folder and that this HTML is opened from a browser with local file access enabled.
loan_cost_by_race_Suburban_Cook.png / .jpg / .jpegCheck the file exists in the graphs folder and that this HTML is opened from a browser with local file access enabled.
loan_cost_by_race_Chicago.png / .jpg / .jpegCheck the file exists in the graphs folder and that this HTML is opened from a browser with local file access enabled.
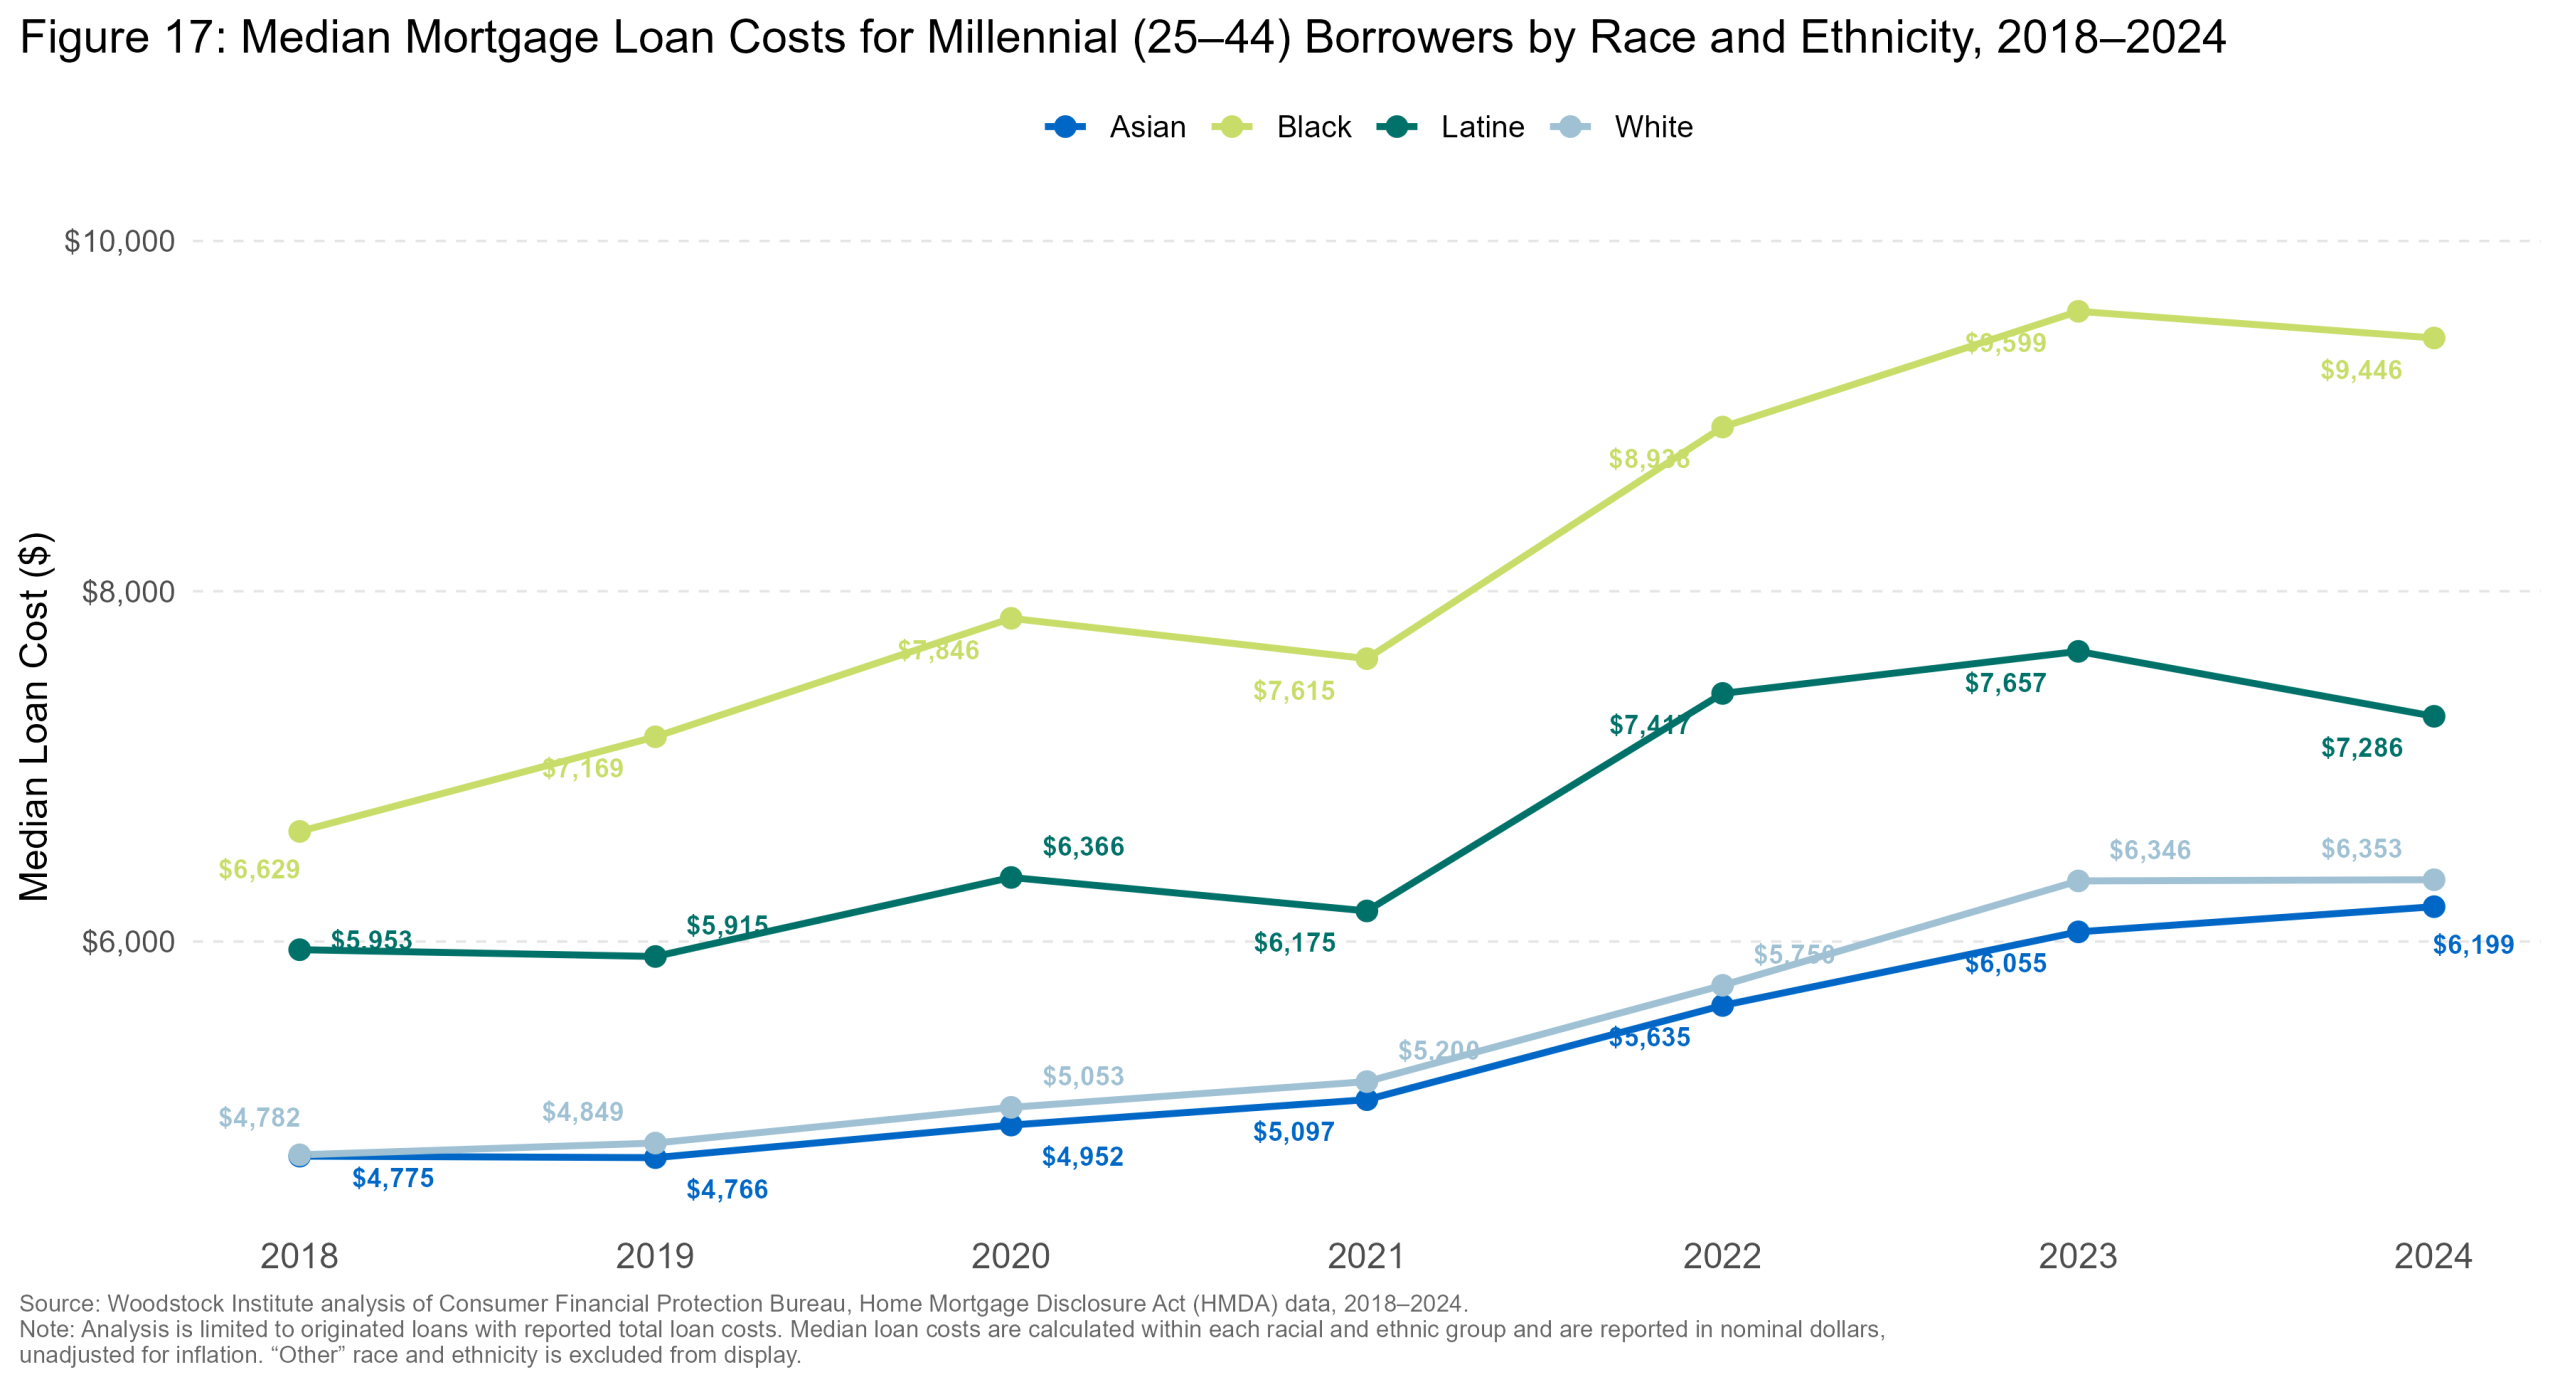
The six collar counties had the largest disparities in loan costs: Black applicants paid almost $3,250 more than Asian borrowers and $3,100 more than White borrowers to close, even though Black borrowers’ loan amounts are substantially smaller. In suburban Cook County, the gap between the borrowers with the highest loan costs, Black borrowers, and the lowest, White borrowers, was $2,612. And in Chicago, the gap between Asian and Black borrowers was $2,154. (Figure 17)
Even with lower loan amounts and property values, Black and Latine borrowers are paying more to obtain a mortgage; this compounds with high DTI and CLTV, and lower incomes. The cash needed up front to close on the loan can limit the amount of reserves available to maintain the property, which can lead to deferred maintenance, impacting long-term neighborhood stability. Part of this cost gap may be explained by where different borrowers are getting their loans. The next sections examine whether the concentration of Black and Latine borrowers in particular loan products and lender channels help explain why they pay more relative to the amount borrowed.
Loan type
Applicants with a higher DTI, smaller down payments and less in reserves may depend more heavily on government-insured loans, as noted previously, which can carry higher upfront costs. Government-secured Federal Housing Administration (FHA) loans are the most expensive loan type for every millennial racial and ethnic group across Illinois, as measured by both median loan costs and costs as a percentage of the loan amount. These loans include a mortgage insurance premium, which generally consists of additional upfront costs and premiums paid over the life of the loan or until certain equity requirements are met. Half of the loans to Black borrowers are FHA, a third of Latine borrowers, 12.7 percent of White borrowers, and only 5.6 percent of Asian borrowers. Black and Latine millennial FHA borrowers face the highest relative costs, at 4.45 percent and 4.22 percent of the total loan amount, respectively, compared with 3.99 percent for White millennial borrowers, and 3.58 percent for Asian millennial borrowers. In dollar value, Asian borrowers paid more for FHA loans, with over $10,000 in costs, but they also had the highest property value amongst all groups. Latine and Black borrowers pay $700 to $1,075 less, respectively, than Asian borrowers for FHA loans, but their median loan amounts are $60,000 to $80,000, respectively, lower than Asian borrowers, ultimately paying more for a smaller loan with potentially lower equity. Some of the mortgage origination costs are associated with the lender and are fixed rather than being proportionate to the loan size, which may explain why smaller loans carry relatively higher costs.
Within the FHA market, Black and Latine borrowers purchased homes with slightly higher median property values than White FHA borrowers. Despite this, Black and Latine FHA borrowers pay higher loan costs in both dollar terms and as a share of the loan amount. The pattern for FHA loans is similar across the six collar counties and suburban Cook County. In Chicago, the area with the highest FHA loan costs of all four geographies, White and Asian borrowers had significantly higher median loan amounts and property values than Black and Latine borrowers. Still, Black and Latine borrowers paid higher costs in comparison to their loan amount. (Table 2)
Higher upfront costs create an additional barrier to sustainable homeownership by increasing the cash required to close for borrowers who typically have lower incomes, less in financial reserves, and smaller loan amounts. As a result, a greater share of down payment assistance may be absorbed by closing and origination costs rather than reducing the amount financed and increasing borrower’s equity.
| Loan Cost Metrics | Application Mix | ||||||
|---|---|---|---|---|---|---|---|
| Loan Type | Race/Ethnicity | Median Loan Cost | Median Loan Amount | Median Property Value | Cost / Loan Amount | Share of Group Originations | Number |
| Conventional | Asian | $5,241 | $315k | $385k | 1.66% | 92.9% | 41,119 |
| Black | $5,188 | $215k | $235k | 2.41% | 42.7% | 16,288 | |
| Latine | $5,271 | $225k | $255k | 2.34% | 61.8% | 50,758 | |
| White | $4,882 | $265k | $305k | 1.84% | 79.9% | 273,653 | |
| FHA | Asian | $10,194 | $285k | $295k | 3.58% | 5.6% | 2,546 |
| Black | $9,120 | $205k | $205k | 4.45% | 50.2% | 19,771 | |
| Latine | $9,485 | $225k | $235k | 4.22% | 33.6% | 29,336 | |
| White | $7,373 | $185k | $185k | 3.99% | 12.7% | 45,761 | |
| VA | Asian | $6,690 | $305k | $305k | 2.19% | 1.4% | 653 |
| Black | $5,592 | $265k | $265k | 2.11% | 6.8% | 2,718 | |
| Latine | $6,286 | $285k | $285k | 2.21% | 4.3% | 3,746 | |
| White | $5,256 | $245k | $245k | 2.15% | 5.4% | 19,550 | |
| USDA | Asian | — | — | — | — | 0.1% | 27 |
| Black | $3,657 | $105k | $105k | 3.48% | 0.3% | 129 | |
| Latine | $3,837 | $115k | $115k | 3.34% | 0.3% | 269 | |
| White | $3,555 | $105k | $105k | 3.39% | 2.0% | 7,020 | |
| Source: Woodstock Institute analysis of Consumer Financial Protection Bureau, Home Mortgage Disclosure Act (HMDA) data, 2018–2024. Note: Analysis is limited to originated loans with reported total loan costs. “k” indicates that median property values are reported in thousands of dollars. Cost-to-loan amount is calculated as median total loan costs divided by median loan amount. Share of group originations represents the percentage of originations within each racial and ethnic group using each loan type. Values based on fewer than 30 originations are suppressed and shown as “—.” “Other” race and ethnicity is excluded. | |||||||
| Loan Cost Metrics | Application Mix | ||||||
|---|---|---|---|---|---|---|---|
| Loan Type | Race/Ethnicity | Median Loan Cost | Median Loan Amount | Median Property Value | Cost / Loan Amount | Share of Group Originations | Number |
| Conventional | Asian | $5,243 | $345k | $415k | 1.52% | 92.4% | 17,765 |
| Black | $5,360 | $265k | $295k | 2.02% | 43.5% | 3,212 | |
| Latine | $5,281 | $225k | $255k | 2.35% | 60.5% | 18,952 | |
| White | $5,155 | $285k | $335k | 1.81% | 82.6% | 91,350 | |
| FHA | Asian | $10,344 | $285k | $305k | 3.63% | 6.3% | 1,226 |
| Black | $9,678 | $235k | $245k | 4.12% | 46.8% | 3,519 | |
| Latine | $9,233 | $215k | $225k | 4.29% | 35.0% | 11,438 | |
| White | $9,299 | $235k | $245k | 3.96% | 12.8% | 14,301 | |
| VA | Asian | $7,175 | $305k | $305k | 2.35% | 1.3% | 255 |
| Black | $6,919 | $305k | $305k | 2.27% | 9.6% | 723 | |
| Latine | $6,554 | $285k | $285k | 2.3% | 4.4% | 1,438 | |
| White | $7,111 | $305k | $315k | 2.33% | 4.4% | 4,980 | |
| USDA | Black | — | — | — | — | 0.1% | 4 |
| Latine | — | — | — | — | 0.0% | 15 | |
| White | $6,556 | $175k | $180k | 3.75% | 0.1% | 114 | |
| Source: Woodstock Institute analysis of Consumer Financial Protection Bureau, Home Mortgage Disclosure Act (HMDA) data, 2018–2024. Note: Analysis is limited to originated loans with reported total loan costs. “k” indicates that median property values are reported in thousands of dollars. Cost-to-loan amount is calculated as median total loan costs divided by median loan amount. Share of group originations represents the percentage of originations within each racial and ethnic group using each loan type. Values based on fewer than 30 originations are suppressed and shown as “—.” “Other” race and ethnicity is excluded. | |||||||
| Loan Cost Metrics | Application Mix | ||||||
|---|---|---|---|---|---|---|---|
| Loan Type | Race/Ethnicity | Median Loan Cost | Median Loan Amount | Median Property Value | Cost / Loan Amount | Share of Group Originations | Number |
| Conventional | Asian | $5,314 | $305k | $365k | 1.74% | 92.0% | 10,202 |
| Black | $5,450 | $195k | $215k | 2.79% | 39.4% | 4,561 | |
| Latine | $5,500 | $225k | $255k | 2.44% | 60.2% | 13,279 | |
| White | $5,307 | $295k | $355k | 1.8% | 89.2% | 51,007 | |
| FHA | Asian | $10,490 | $295k | $305k | 3.56% | 6.7% | 753 |
| Black | $9,191 | $195k | $195k | 4.71% | 55.6% | 6,664 | |
| Latine | $9,812 | $235k | $235k | 4.18% | 36.8% | 8,609 | |
| White | $9,789 | $245k | $255k | 4% | 8.8% | 5,091 | |
| VA | Asian | $7,324 | $325k | $335k | 2.25% | 1.3% | 143 |
| Black | $5,812 | $255k | $255k | 2.28% | 5.0% | 599 | |
| Latine | $6,747 | $300k | $305k | 2.25% | 3.0% | 710 | |
| White | $7,213 | $315k | $325k | 2.29% | 2.0% | 1,170 | |
| Source: Woodstock Institute analysis of Consumer Financial Protection Bureau, Home Mortgage Disclosure Act (HMDA) data, 2018–2024. Note: Analysis is limited to originated loans with reported total loan costs. “k” indicates that median property values are reported in thousands of dollars. Cost-to-loan amount is calculated as median total loan costs divided by median loan amount. Share of group originations represents the percentage of originations within each racial and ethnic group using each loan type. Values based on fewer than 30 originations are suppressed and shown as “—.” “Other” race and ethnicity is excluded. | |||||||
| Loan Cost Metrics | Application Mix | ||||||
|---|---|---|---|---|---|---|---|
| Loan Type | Race/Ethnicity | Median Loan Cost | Median Loan Amount | Median Property Value | Cost / Loan Amount | Share of Group Originations | Number |
| Conventional | Asian | $5,540 | $335k | $425k | 1.65% | 96.6% | 9,969 |
| Black | $5,552 | $245k | $265k | 2.27% | 46.3% | 5,683 | |
| Latine | $5,577 | $255k | $285k | 2.19% | 66.3% | 12,874 | |
| White | $5,433 | $365k | $435k | 1.49% | 94.9% | 54,305 | |
| FHA | Asian | $12,274 | $360k | $375k | 3.41% | 2.4% | 250 |
| Black | $10,233 | $235k | $235k | 4.35% | 49.7% | 6,095 | |
| Latine | $10,636 | $265k | $275k | 4.01% | 30.5% | 6,282 | |
| White | $11,319 | $325k | $335k | 3.48% | 3.6% | 1,982 | |
| VA | Asian | $6,469 | $385k | $385k | 1.68% | 1.0% | 106 |
| Black | $6,675 | $285k | $285k | 2.34% | 4.0% | 501 | |
| Latine | $7,372 | $315k | $325k | 2.34% | 3.2% | 656 | |
| White | $8,333 | $385k | $385k | 2.16% | 1.5% | 851 | |
| Source: Woodstock Institute analysis of Consumer Financial Protection Bureau, Home Mortgage Disclosure Act (HMDA) data, 2018–2024. Note: Analysis is limited to originated loans with reported total loan costs. “k” indicates that median property values are reported in thousands of dollars. Cost-to-loan amount is calculated as median total loan costs divided by median loan amount. Share of group originations represents the percentage of originations within each racial and ethnic group using each loan type. Values based on fewer than 30 originations are suppressed and shown as “—.” “Other” race and ethnicity is excluded. | |||||||
In addition to the cost, the median property values for FHA loans are lower than conventional and Veterans Affairs (VA) loans. Conventional loans, the most affordable loan type, are less accessible for Black millennial borrowers in Illinois, likely due to debt and down payment constraints. Only 42.7 percent of Black borrowers receive conventional loans, compared to 61.8 percent of Latine borrowers, 79.9 percent of White borrowers, and 92.9 percent of Asian borrowers. Conventional loan costs only account for 1.66 to 2.41 percent of the loan amount, with Asian and White borrowers’ costs among the lowest percentages of their loan amount. In addition to borrowing cost, the median property values for conventional loans are $20,000 to $70,000 higher than the median loan amount across all racial groups, reflecting conventional borrowers’ stronger financial positioning and initial equity.
Compared to FHA, property values were the same as or only $10,000 more than loan amounts, indicating a much smaller equity cushion at purchase. The racial disparity in access to conventional lending is important because conventional loans not only have lower borrowing costs, but they are also being used to finance higher value homes with more initial equity. This has a lot to do with the borrower’s financial positioning, down payment and the property’s value, making its benefits out of reach for some borrowers. These financing advantages reduce the upfront cost of homeownership and position borrowers to enter homeownership on stronger financial footing and more equity than borrowers who rely on FHA loans, primarily Black and Latine borrowers.
U.S. Department of Veterans Affairs’ (VA) loans are used by Black millennial borrowers more than any other group in Illinois, with the highest concentration in the six collar counties, accounting for nearly ten percent of Black borrowers. White borrowers' use of USDA loans, typically used for rural housing loans, was more than any other group at two percent across Illinois. The costs of these loans were generally stable with minimal disparities in overall median cost and percentage of loan amount. (Table 2)
The loan cost patterns and access to conventional and FHA loans suggest that disparities in mortgage access extend beyond whether borrowers are approved, but also the loan type available to them. In 2021, Woodstock Institute’s Mortgage Access Initiative research found that Black and Latine borrowers may be steered into FHA loans, even when they could have qualified for a conforming loan product27. The loan type also shapes the price borrowers must pay to become homeowners and the financial position in which they begin homeownership. White and Asian borrowers are more likely to obtain lower-cost conventional loans. Black and Latine millennials are more likely to rely on FHA loans and, within that market, face costs that are larger relative to substantially smaller loan amounts and lower incomes. Although FHA lending expands access for borrowers with lower down payments, its higher upfront costs may also reduce the cash available to pay down equity or build up reserves for repairs and other expenses related to purchasing or maintaining a home. Without efforts to reduce excessive loan charges, expand access to affordable conventional credit, and provide targeted down payment and closing cost assistance, the mortgage system may continue to reproduce historic and persistent racial disparities or produce new homeowners with limited financial flexibility.
Lender types
Lender type is also associated with differences in loan costs. Non-bank lenders dominate the mortgage market and are the most expensive source of mortgage credit across all millennial groups in Illinois. Black and Latine borrowers are more likely than Asian or White borrowers to use non-bank lenders. Two-thirds of Black borrowers and 61.4 percent of Latine borrowers obtained their loans from non-bank lenders in Illinois, compared with 56.8 percent of Asian borrowers and 51.8 percent of White borrowers. Black borrowers using non-bank lenders had the highest median costs at $7,913, equal to 3.68 percent of their median loan amount of $215,000. By comparison, White non-bank borrowers paid $5,398, or 2.12 percent of their loan amount. Approximately, 43.4 percent of White borrowers and 40.5 percent of Asian borrowers were served by banks, compared to only about a third of Black and Latine borrowers. Although costs were more comparable across racial groups among bank borrowers, those costs represented a larger share of the smaller median loan amounts received by Black and Latine borrowers. Credit unions offered the lowest-financing cost across most groups and had the smallest share of loans across all races. (Table 3)
| Loan Cost Metrics | Application Mix | ||||||
|---|---|---|---|---|---|---|---|
| Lender Type | Race/Ethnicity | Median Loan Cost | Median Loan Amount | Median Property Value | Cost / Loan Amount | Share of Group Originations | Number |
| Bank | Asian | $5,116 | $315k | $385k | 1.62% | 40.5% | 16,012 |
| Black | $5,573 | $205k | $215k | 2.72% | 31.6% | 11,384 | |
| Latine | $5,333 | $215k | $245k | 2.48% | 33.6% | 25,882 | |
| White | $4,516 | $235k | $275k | 1.92% | 43.4% | 134,578 | |
| Credit Union | Asian | $4,583 | $265k | $325k | 1.73% | 2.7% | 1,092 |
| Black | $4,026 | $165k | $185k | 2.44% | 2.6% | 824 | |
| Latine | $4,730 | $185k | $215k | 2.56% | 5.1% | 2,252 | |
| White | $2,457 | $175k | $215k | 1.4% | 4.8% | 14,487 | |
| Non-Bank | Asian | $5,548 | $325k | $385k | 1.71% | 56.8% | 25,037 |
| Black | $7,913 | $215k | $225k | 3.68% | 65.8% | 24,672 | |
| Latine | $7,355 | $235k | $255k | 3.13% | 61.4% | 50,002 | |
| White | $5,398 | $255k | $285k | 2.12% | 51.8% | 174,302 | |
| Source: Woodstock Institute analysis of Consumer Financial Protection Bureau, Home Mortgage Disclosure Act (HMDA) data, 2018–2024. Note: Analysis is limited to originated loans with reported total loan costs. “k” indicates that median property values are reported in thousands of dollars. Cost-to-loan amount is calculated as median total loan costs divided by median loan amount. Share of group originations represents the percentage of originations within each racial and ethnic group using each lender type. Values based on fewer than 30 originations are suppressed and shown as “—.” “Other” race and ethnicity and unknown lender types are excluded. | |||||||
| Loan Cost Metrics | Application Mix | ||||||
|---|---|---|---|---|---|---|---|
| Lender Type | Race/Ethnicity | Median Loan Cost | Median Loan Amount | Median Property Value | Cost / Loan Amount | Share of Group Originations | Number |
| Bank | Asian | $5,208 | $335k | $395k | 1.55% | 34.6% | 5,740 |
| Black | $6,100 | $255k | $265k | 2.39% | 28.9% | 1,946 | |
| Latine | $5,417 | $215k | $235k | 2.52% | 31.8% | 9,199 | |
| White | $5,103 | $285k | $335k | 1.79% | 36.6% | 36,193 | |
| Credit Union | Asian | $5,174 | $305k | $375k | 1.7% | 2.0% | 279 |
| Black | $5,033 | $230k | $245k | 2.19% | 2.1% | 108 | |
| Latine | $5,310 | $205k | $245k | 2.59% | 4.9% | 889 | |
| White | $5,070 | $255k | $305k | 1.99% | 2.8% | 2,455 | |
| Non-Bank | Asian | $5,480 | $345k | $405k | 1.59% | 63.4% | 12,427 |
| Black | $8,420 | $255k | $265k | 3.3% | 69.0% | 5,051 | |
| Latine | $7,536 | $235k | $255k | 3.21% | 63.3% | 19,290 | |
| White | $5,651 | $275k | $315k | 2.05% | 60.6% | 64,756 | |
| Source: Woodstock Institute analysis of Consumer Financial Protection Bureau, Home Mortgage Disclosure Act (HMDA) data, 2018–2024. Note: Analysis is limited to originated loans with reported total loan costs. “k” indicates that median property values are reported in thousands of dollars. Cost-to-loan amount is calculated as median total loan costs divided by median loan amount. Share of group originations represents the percentage of originations within each racial and ethnic group using each lender type. Values based on fewer than 30 originations are suppressed and shown as “—.” “Other” race and ethnicity and unknown lender types are excluded. | |||||||
| Loan Cost Metrics | Application Mix | ||||||
|---|---|---|---|---|---|---|---|
| Lender Type | Race/Ethnicity | Median Loan Cost | Median Loan Amount | Median Property Value | Cost / Loan Amount | Share of Group Originations | Number |
| Bank | Asian | $5,165 | $305k | $365k | 1.69% | 38.4% | 3,722 |
| Black | $6,206 | $195k | $205k | 3.18% | 28.8% | 3,096 | |
| Latine | $5,762 | $225k | $245k | 2.56% | 30.4% | 6,421 | |
| White | $5,263 | $315k | $375k | 1.67% | 38.4% | 19,888 | |
| Credit Union | Asian | $5,249 | $305k | $375k | 1.72% | 1.8% | 155 |
| Black | $5,215 | $190k | $205k | 2.74% | 1.8% | 146 | |
| Latine | $5,274 | $235k | $265k | 2.24% | 3.9% | 249 | |
| White | $5,201 | $255k | $315k | 2.04% | 2.6% | 1,134 | |
| Non-Bank | Asian | $5,662 | $305k | $355k | 1.86% | 59.8% | 6,483 |
| Black | $8,293 | $195k | $205k | 4.25% | 69.5% | 7,925 | |
| Latine | $7,723 | $235k | $245k | 3.29% | 65.7% | 14,274 | |
| White | $5,666 | $285k | $325k | 1.99% | 59.0% | 31,995 | |
| Source: Woodstock Institute analysis of Consumer Financial Protection Bureau, Home Mortgage Disclosure Act (HMDA) data, 2018–2024. Note: Analysis is limited to originated loans with reported total loan costs. “k” indicates that median property values are reported in thousands of dollars. Cost-to-loan amount is calculated as median total loan costs divided by median loan amount. Share of group originations represents the percentage of originations within each racial and ethnic group using each lender type. Values based on fewer than 30 originations are suppressed and shown as “—.” “Other” race and ethnicity and unknown lender types are excluded. | |||||||
| Loan Cost Metrics | Application Mix | ||||||
|---|---|---|---|---|---|---|---|
| Lender Type | Race/Ethnicity | Median Loan Cost | Median Loan Amount | Median Property Value | Cost / Loan Amount | Share of Group Originations | Number |
| Bank | Asian | $5,475 | $345k | $445k | 1.59% | 47.3% | 4,537 |
| Black | $6,193 | $235k | $245k | 2.64% | 33.5% | 3,855 | |
| Latine | $5,737 | $255k | $275k | 2.25% | 34.1% | 6,340 | |
| White | $5,388 | $395k | $485k | 1.36% | 40.8% | 21,445 | |
| Credit Union | Asian | $5,688 | $365k | $445k | 1.56% | 1.9% | 205 |
| Black | $5,486 | $255k | $285k | 2.15% | 1.2% | 140 | |
| Latine | $5,542 | $250k | $295k | 2.22% | 4.3% | 220 | |
| White | $5,480 | $325k | $415k | 1.69% | 2.6% | 1,319 | |
| Non-Bank | Asian | $5,687 | $325k | $405k | 1.75% | 50.8% | 5,042 |
| Black | $8,897 | $245k | $255k | 3.63% | 65.4% | 7,679 | |
| Latine | $7,552 | $265k | $285k | 2.85% | 61.6% | 11,964 | |
| White | $5,615 | $345k | $405k | 1.63% | 56.6% | 30,515 | |
| Source: Woodstock Institute analysis of Consumer Financial Protection Bureau, Home Mortgage Disclosure Act (HMDA) data, 2018–2024. Note: Analysis is limited to originated loans with reported total loan costs. “k” indicates that median property values are reported in thousands of dollars. Cost-to-loan amount is calculated as median total loan costs divided by median loan amount. Share of group originations represents the percentage of originations within each racial and ethnic group using each lender type. Values based on fewer than 30 originations are suppressed and shown as “—.” “Other” race and ethnicity and unknown lender types are excluded. | |||||||
Across all geographies, non-bank lenders served the majority of all racial groups, with Black and Latine borrowers having the highest loan costs and the highest percentage of their loan amounts, consistently. These patterns suggest that Black and Latine borrowers are not only more likely to use higher cost lenders, but also pay more relative to the amount borrowed, further increasing the financial burden of becoming homeowners. The result is a compounding pattern: the borrowers entering the market with the least financial flexibility are also more likely to obtain credit through the products and institutions that consume the greatest share of that flexibility. Higher costs leave less money available for repairs, reserves, and other expenses necessary to sustain homeownership.
Addressing the barriers millennial buyers face to not only own a home, but build wealth, especially Black and Latine borrowers, will require policy interventions that reduce upfront costs, expand access to responsible credit, and strengthen homeowners’ financial stability after purchase. While these challenges affect all generations of borrowers broadly, millennials in their prime homebuying years are navigating historically high interest rates and property values. At the same time, Black and Latine millennials continue to face persistent disparities including higher borrowing costs, and lower equity. Policies that improve access to affordable and sustainable homeownership can support millennial homebuyers as well as the broader market, while also addressing the deeper disparities experienced by Black and Latine borrowers. The following section reviews current federal and state policy, and other activities intended to improve access to homeownership.
Current policies and activities
Federally, the 21st Century ROAD to Housing Act28, which became law on July 11, 2026, provides policy interventions that may expand the housing financing system, support homeowners, and reduce barriers that restrict housing supply. This Act supports community banks, locally owned, medium, and small depository institutions with less than $10 billion in assets. Historically, community banks have been instrumental in providing credit access in rural communities and local bank branch access29. As traditional financial institutions reduce their participation in mortgage lending, this provides opportunities for local community banks to increase their role and directly serve their community. Additionally, the Act includes a home repair initiative to fund critical home repairs, which can help preserve aging housing stock and stabilize housing supply. This Act also provides initiatives that would provide access to smaller loans, down payment assistance, limit institutional investors, create savings programs for lower income households, and minimize zoning barriers. Together, these provisions could help address multiple barriers to homeownership by expanding access to credit, reducing upfront costs, strengthening community banking, and supporting long term financial and community stability. However, the impact of these initiatives will depend on their implementation and whether the benefits reach borrowers and communities with the greatest barriers to homeownership.
Next, the Community Reinvestment Act (CRA) at the state and federal level are critical for credit access in low- and moderate-income (LMI) neighborhoods. Consistent evaluation of financial institutions provides benchmarks to monitor the performance of financial institutions and hold them accountable to the LMI communities they serve. In 2026, the Office of the Comptroller of the Currency (OCC) and the Federal Deposit Insurance Corporation (FDIC) proposed a rule to roll back CRA enforcement activities and transparency30, which would weaken bank obligations to serve LMI communities31. This action will likely reduce investments in those communities, potentially worsening credit access disparities. In Illinois, the state CRA, passed in January 2021, requires state-chartered banks, state-chartered credit unions, and non-bank mortgage licensees to meet the needs of historically underserved communities. The Illinois Department of Financial and Professional Regulation (IDFPR) evaluates banks, credit unions, and mortgage lenders under this law to help ensure that state regulated financial institutions better meet the needs of LMI neighborhoods. Unfortunately, many state CRA laws are tied to the federal CRA in terms of definitions, thresholds and standards. Enforcement of the state and federal CRA is imperative to hold banks accountable, ensure equal access to credit, and to identify communities with the greatest disparities, and should not be weakened.
Locally, down payment assistance and housing preservation programs continue to provide assistance for prospective homebuyers and owners to increase access to credit and stabilize housing supply. The Illinois Housing and Development Authority (IHDA) and Governor Pritzker recently launched IHDAccess Home to decrease the entry costs to owning a home32. As noted previously, FHA and conventional mortgage loans have significant disparities in costs and access. In Cook County, the board of commissioners approved funds for down payment assistance programs33. In Chicago, the HomeGrown Purchase Assistance34 grant supports low- and moderate-income applicants to achieve homeownership with down payment and closing cost assistance. Although down payment assistance programs are helpful, many of the funds are limited, tend to have long waitlists and can be inaccessible. In most cases, repairing a home is cheaper than building a new home. Policy and funding initiatives that support home repair and weatherization could stabilize current housing stock and neighborhoods. Organizations like Fix Our Homes Illinois support home repair initiatives for some of our most vulnerable homeowners: low- and moderate-income seniors. Deferred maintenance on aging housing stock as well as access disparities in home improvement lending35 create homes and neighborhoods in need of repair, contributing to a deteriorating housing supply. These programs play an important role in community stabilization for current and future generations. Many down payment assistance and home repair programs are funneled through local housing counseling agencies working directly with community members.
Housing counseling agencies and their programs prepare applicants for homeownership and are crucial in creating a pipeline of mortgage-ready borrowers for lending institutions, especially for first-time homebuyers entering the market. Pre-purchase and delinquency programs help prospective owners understand the true cost of homeownership and provide resources to support homeowners after purchasing. These agencies are currently being threatened by the Department of Housing and Urban Development’s (HUD) federal funding cuts, threatening their ability to perform essential housing counseling services. Many local organizations and representatives, such as Housing Action Illinois36 and U.S. Senator Mark R. Warner37, oppose these dangerous policy changes and are advocating for funding increases and not cuts. Additionally, many housing counseling agencies that support fair housing enforcement and increased access to mortgages to limit disparities and are also being threatened by HUD cuts. Housing counseling agencies work closely with local lending institutions, and underfunding these organizations may harm homebuyers, especially LMI households, housing counseling agencies, and lenders, which can limit access to credit, potentially increasing the racial wealth gap.
The Home Mortgage Disclosure Act (HMDA) continues to be an essential data source for understanding local and national mortgage markets. HMDA’s detailed applicant- and loan-level data provides a solid foundation for research, advocacy, fair lending analysis, and partnerships with lending institutions. Continued access to comprehensive HMDA data is critical for tracking changes in lending over time, identifying communities and borrowers experiencing persistent disparities, and evaluating the performance of financial institutions.
These local, state, and federal policies and programs, as well as many of the current disparities in income and access to credit, affect all prospective homebuyers. For millennials, these are the conditions that they are entering the market with, and if these issues persist, can negatively impact future generations, limiting access to mortgage credit and opportunities to build generational wealth through homeownership.
Policy and program recommendations
The findings in this report demonstrate that mortgage access alone is not sufficient to ensure sustainable homeownership and narrow the racial wealth gap. For many Black and Latine millennial borrowers, financial vulnerability is cumulative. Lower incomes, high debt burdens, and lower property values may combine with elevated loan-to-income ratios, smaller equity cushions, and greater mortgage financing costs to create financially fragile homeowners and slower wealth accumulation. These borrowers are also more likely to rely on, or be steered to, FHA loans and high-cost lenders, which are associated with higher costs and barriers to entry. Together, these conditions can leave new homeowners with limited financial flexibility after closing and less capacity to absorb home repairs, increases in property taxes or insurance, loss of income, or other unexpected expenses. Policies and programs intended to expand homeownership should also consider programming that supports sustaining homeownership after closing. Down payment and closing cost assistance, access to lower-cost mortgage products, pre- and post-purchase housing counseling, affordable repair financing, and opportunities to build emergency savings and reserves can help reduce these cumulative pressures and support long-term homeownership.
Policies that reduce or forgive student loan debt may also strengthen homeownership readiness by lowering monthly debt obligations and increasing households’ capacity to save for a down payment, closing costs, and financial reserves. Student debt relief should complement rather than replace broader efforts to address income, credit access, and wealth disparities. This would be particularly important for reducing racial wealth disparities given the disproportionate student debt burden carried by younger Black households.
Financial institutions should have a continued responsibility to serve low- and moderate-income communities. Lending institutions should continue to be evaluated for compliance with laws aimed at minimizing disparities. Additionally, lending institutions should continue to work with housing counseling agencies and key stakeholders to improve marketing outreach and support the mortgage-ready pipeline receiving pre-counseling services. Many coalitions and community organizations are working to improve state policy, modernize lender processes to expand mortgage access, and examine non-traditional wealth-building and savings programs to support low- and moderate-income families’ financial positioning.
Collaboration between financial institutions and community organizations can support increased equity and change within financial systems. In 2021, Neighborhood Housing Services and Woodstock Institute met with mortgage lenders to discuss barriers to homeownership for low- and moderate-income, Black, and Latine households. These meetings helped develop the Mortgage Access Initiative Phase 1’s three recommendations: create an equitable mortgage product; ensure eligible borrowers receive information on conforming loans, not just FHA loans; and address loan officer compensation and their relationship with housing counselors38. These types of cross-sector initiatives help guide advocacy efforts that drive changes within financial systems to advance economic justice and racial equity.
Non-traditional real estate models like community land trusts and limited equity housing cooperatives provide an opportunity for households to build community wealth but have their own share of limitations and requirements. A community land trust39, usually built through a non-profit organization that owns the property and the land separately, creates permanent affordable housing that allows owners to build wealth. Equity is accumulated as property value appreciates over time and is distributed to property owners according to the cooperative or land trust structure. Although this ownership structure can be complex to finance and has limited access to subsidy programs, non-traditional real estate investment models allow residents living in multi-unit properties, that would otherwise rent, to access equity and start accumulating wealth. Limited equity cooperatives provide similar wealth-building opportunities by converting privately owned rental buildings into a collective equity investment that aims to preserve long-term affordability. Members can purchase an affordable share in the property to gain occupancy rights and could potentially sell those rights for a modest profit, usually capped to keep the property affordable. Like land trusts, financing these properties can be complex, and many of these deals rely on financial support. Additionally, the costs of rehabilitation and accessibility improvements can increase costs, posing yet another strain on financing. These nontraditional real estate models do not generate wealth the same way that traditional homeownership does, but they may allow long-term renters to leave properties with some equity payout. These models rely heavily on tenant involvement and motivation while also needing to meet stringent financing requirements. A local initiative like the Pilsen Housing Cooperative40, a limited-equity scattered site cooperative for long-term residents in the Pilsen neighborhood of Chicago, has successfully expanded homeownership and equity opportunities for residents who may otherwise have been displaced by gentrification.
Homeownership is not the only way to build wealth, and policies and programs that support household savings can improve the financial stability of households. As younger generations deprioritize homeownership as a path to wealth, they are increasingly building wealth through investment applications and retirement accounts41. Access to employer-sponsored retirement plans can support long-term wealth accumulation, while employer-sponsored emergency savings programs can help households build more liquid reserves for unexpected expenses. For financially fragile homeowners, access to emergency savings may provide financial relief for unexpected home repairs, increases in property taxes and insurance, income disruptions, and other costs that could require the use of high-cost or predatory credit. Expanding access to workplace retirement plans, automatic savings programs, and employer-supported emergency savings can complement homeownership and financial stability policies by strengthening household financial capacity before and after home purchases. The Corporate Coalition of Chicago, a corporate and non-profit coalition working to reduce economic and racial inequities, has piloted the Workplace Flex Fund in partnership with Woodstock Institute. This program works with employers and financial institutions to help their employees get access to affordable emergency funds while also helping them build savings and credit42.
More research should be done to understand the requirements of non-traditional real estate equity models, employer-funded retirement and savings programs, and the long-term impact on wealth disparities.
Conclusion
Millennials now represent a central share of Illinois's mortgage market, but their opportunities to become homeowners have disparities shaped by race, income, cost of credit, and financial conditions. The findings show that this gap is cumulative rather than confined to a single approval decision. Black and Latine millennials are underrepresented among applicants compared to their population share and are more likely to enter the market with lower incomes, higher debt burdens, and less initial equity. The origination and denial rates for these groups show significant disparities in comparison to their White and Asian peers, even for well-qualified applicants. And even of the Black and Latine borrowers approved for loans, higher loan costs for smaller loan amounts impact the sustainability of homeownership as well as equity accumulation. At almost every stage, from market entry to underwriting to the price of credit, each disadvantage leads to and compounds upon another.
Sustainable homeownership, generational wealth accumulation, and neighborhood stability start with the financial condition of homeowners. A mortgage that enables a household to purchase a home but leaves no capacity for repairs, emergencies, or income disruptions provides access without adequate stability. The households most likely to need affordable repair financing may also struggle to obtain a home improvement loan later down the line35, especially if repair issues are deferred. Programs that help households close on a loan may fall short if long-term costs of maintaining the property and remaining financially stable after purchase aren’t prioritized. Additionally, access to long-term savings accounts and retirement benefits through employment can fund emergency savings and provide financial stability. Strengthening financial capacity and access to housing counseling agencies can help financially fragile applicants prepare for homeownership and help new financially constrained homeowners maintain their home and prevent foreclosure.
These findings reflect the patterns and limitations within the traditional home financing system that have historically distributed access to wealth unevenly. Homeownership remains the primary pathway to wealth building, but discriminatory lending, exclusionary housing policies, unequal access to appreciating neighborhoods, and higher borrowing costs have created barriers to wealth building historically for marginalized groups. Expanding access to the existing system without changing the conditions within it may reproduce these disparities for another generation. Policies and programs should address the unequal access to traditional mortgage lending while also supporting non-traditional and shared-equity models, including community land trusts, limited-equity cooperatives, tenant-to-owner cooperatives, and other structures that reduce individual financial risk and expand opportunities for long-term stability and wealth building.
Acknowledgements
Prepared by the Woodstock Institute Research Team: Serrater Chapman, Director of Applied Research; Yufei Liu, Fair Lending Research Analyst; and Sukriti Sood, Research Analyst. Many thanks to Spencer Cowan, Calvin Bradford, Jane Doyle, Horacio Mendez, Jestine Ware, Rob Mayo, Myanno Miller, and Beverly Berryhill for their guidance, feedback, and support throughout the development of this report.
Footnotes
- National Association of Realtors®, “Highlights From the Profile of Home Buyers and Sellers”, November 2025, https://www.nar.realtor/research-and-statistics/research-reports/highlights-from-the-profile-of-home-buyers-and-sellers. ↩
- Cramer, Reid et al., New America. “The Emerging Millennial Wealth Gap: Divergent Trajectories, Weak Balance Sheets, and Implications for Social Policy”. October 2019. https://www.newamerica.org/insights/emerging-millennial-wealth-gap ↩
- Rich, Robert, “The Great Recession”. Federal Reserve History. November 22, 2013. https://www.federalreservehistory.org/essays/great-recession-of-200709 ↩
- Bailik, Kristen, and Fry, Richard. “Millennial life: How young adulthood today compares with prior generations”. February 14, 2019. https://www.pewresearch.org/social-trends/2019/02/14/millennial-life-how-young-adulthood-today-compares-with-prior-generations-2 ↩
- Trends in College Pricing: Figure 9, 2018.” The College Board. https://research.collegeboard.org/trends/college-pricing/report-archive ↩
- Freddie Mac, “Millennials and Housing”, 2021, https://sf.freddiemac.com/docs/pdf/fact-sheet/millennial-playbook_millennials-and-housing.pdf. ↩
- Choi, Jung H., Goodman, Laurie, Zhu, Jun. “Homeownership Among Young Adults Has Fallen, and It’s Worse Than You Think”. Urban Institute, May 28, 2026. https://www.urban.org/urban-wire/homeownership-among-young-adults-has-fallen-and-its-worse-you-think. ↩
- AARP Press Release, “New AARP Report: Majority of Adults 50-plus Want to Age in Place, But Policies and Communities Must Catch Up”, updated December 10, 2024, https://www.aarp.org/press/releases/2024-12-10-new-aarp-report-majority-adults-50-plus-age-place-policies-communities-catch-up.html. ↩
- Daniel McCue, “Ten Takeaways from the 2026 State of the Nation’s Housing,” Joint Center for Housing Studies of Harvard University, June 17, 2026, https://www.jchs.harvard.edu/blog/ten-takeaways-2026-state-nations-housing. ↩
- Millennials are generally defined as those born between 1981 and 1996 — ages 22 to 37 at the start of this report's study period in 2018, and 28 to 43 by its end in 2024. However, the age brackets provided by the Home Mortgage Disclosure Act necessitate identifying millennials as individuals ages 25–44 as a proxy for this 2018–2024 analysis. As a result, this age group may exclude some younger true Millennials in earlier years of the study period, may include a small number of older Generation X borrowers in earlier years, and younger Generation Z borrowers in later years. ↩
- Illinois, six collar counties (DuPage, Kane, Kendall, Lake, McHenry, and Will counties), suburban Cook County, and Chicago, IL ↩
- U.S. Census Bureau. "Tenure." American Community Survey, ACS 5-Year Estimates Detailed Tables, Table B25003, https://data.census.gov/table/ACSDTY52024.B25003?q=B25003&g=160XX00US1714000. Accessed on 27 May 2026. ↩
- Federal Reserve Bank of St. Louis, “Median Sales Price of Houses Sold for the United States (MSPUS)”, 2025, https://fred.stlouisfed.org/series/MSPUS. ↩
- Institute for Housing Studies at DePaul University, "House Price Index," accessed June 2026, https://price-index.housingstudies.org/ ↩
- Estabine, LyLena, Illinois Policy, “Housing Shortage Drives up Illinois Prices 49%”, March 3, 2026, https://www.illinoispolicy.org/housing-shortage-drives-up-illinois-prices-49. ↩
- Freddie Mac, "Primary Mortgage Market Survey," accessed June 2026, https://www.freddiemac.com/pmms. ↩
- Evangelou, Nadia, "The Down Payment Clock: How Long It Takes to Buy a Home, Market by Market," National Association of Realtors, April 2026, June 2026, https://www.nar.realtor/blogs/economists-outlook/the-down-payment-clock-how-long-it-takes-to-buy-a-home-market-by-market. ↩
- The National Association of Realtors “analyzed data from the Home Mortgage Disclosure Act (HMDA) across 180+ markets. Instead of assuming a standard 20% or 10% down payment, we used the down payment buyers made in each market, based on the median loan-to-value ratio among those buyers who took out a mortgage. Then we paired that with median household income and assumed a household could save 15% of their income each year. The result is how many years it takes to save for a down payment, market by market.” ↩
- Trends in College Pricing: Figure 9, 2018.” The College Board. https://research.collegeboard.org/trends/college-pricing/report-archive ↩
- Board of Governors of the Federal Reserve System, “Survey of Consumer Finances, 1989–2022,” last updated November 2, 2023, https://www.federalreserve.gov/econres/scf/dataviz/scf/chart/index.html ↩
- Perry, Andre M., Steinbaum, Marshall, and Romer, Carl. “Student loans, the racial wealth divide, and why we need full student debt cancellation”, June 23, 2021, https://www.brookings.edu/articles/student-loans-the-racial-wealth-divide-and-why-we-need-full-student-debt-cancellation. ↩
- Data from HMDA does not identify the individual components of an applicant’s debt, so these factors provide context through national debt trends and disparities. ↩
- Emmons, William R., Federal Reserve Bank of St. Louis, “The Mortgage Crisis: Let Markets Work, But Compensate the Truly Needy”, July 1, 2008, https://www.stlouisfed.org/publications/regional-economist/july-2008/the-mortgage-crisis-let-markets-work-but-compensate-the-truly-needy ↩
- Michela Zonta, “Racial Disparities in Home Appreciation: Implications of the Racially Segmented Housing Market for African Americans’ Equity Building and the Enforcement of Fair Housing Policies,” Center for American Progress, July 15, 2019, https://www.americanprogress.org/article/racial-disparities-home-appreciation. ↩
- Well-qualified applicants and borrowers are defined as borrowers with a debt-to-income (DTI) ratio of less than or equal to 43 percent and a loan-to-value (LTV) less than or equal to 80 percent. This definition provides a partial measure of applicants’ financial qualifications, but does not account for credit scores, credit history, financial reserves, and financial history. HMDA data does not include credit scores or property condition, which may affect lending outcomes. Despite these gaps in available data, the “well-qualified” filter helps isolate disparities not explained by financial risk factors. ↩
- Dollar amounts are not adjusted for inflation; therefore, part of the increase over time is nominal, reflecting broader price growth. ↩
- Woodstock Institute, “Mortgage Access Initiative”, June 2023, https://woodstockinst.org/mortgage-access-initiative. ↩
- House, 21st Century ROAD to Housing Act, HR 6644, 119th Cong., 2nd sess., introduced in House December 11, 2025, https://www.congress.gov/bill/119th-congress/house-bill/6644. ↩
- Council of Economic Advisers Issue Brief, “The Performance of Community Banks Over Time”, August 2016, https://obamawhitehouse.archives.gov/sites/default/files/page/files/20160810_cea_community_banks.pdf. ↩
- Federal Deposit Insurance Corporation, "Agencies Issue Joint Proposal Amending the Community Reinvestment Act Rules," press release, July 31, 2026, https://www.fdic.gov/news/press-releases/2026/agencies-issue-joint-proposal-amending-community-reinvestment-act-rules. ↩
- NCRC, “The Proposed 2026 CRA Rollbacks: Key Takeaways and Why it Matters”, August 3, 2026, https://ncrc.org/2026-cra-rollbacks. ↩
- Illinois Housing Development Authority, “Gov. Pritzker Launches Down Payment Assistance Program for First-Time Homebuyers”, March 11, 2026, https://www.ncsha.org/hfa-news/gov-pritzker-launches-down-payment-assistance-program-for-first-time-homebuyers. ↩
- Cook County Government, “Cook County Down Payment Assistance Program Now Open”, July 20, 2026, https://www.cookcountyil.gov/news/cook-county-down-payment-assistance-program-now-open-0. ↩
- City of Chicago, “HomeGrown Purchase Assistance”, accessed August 2026, https://www.chicago.gov/city/en/depts/doh/provdrs/homebuyers/svcs/HomeGrown.html. ↩
- Chapman, Serrater and Sood, Sukriti, Woodstock Institute, “Home Improvement Loan Access Limitations in Cook County and Chicago, IL (2021-2024)”, December 2025, https://woodstockinst.org/wp-content/uploads/2025/12/Home-Improvement-Loan-Access-Report-Dec-2025-1.pdf ↩
- Housing Action Illinois, “2026 Mid-Session Legislative Update”, April 2026, https://housingactionil.org/blog/2026/04/01/2026-mid-session-legislative-update. ↩
- Mark Warner, “Warner joins colleagues in fighting back against HUD cuts to housing counseling for homeowners and renters”, May 21, 2026, https://www.warner.senate.gov/newsroom/press-releases/warner-joins-colleagues-in-fighting-back-against-hud-cuts-to-housing-counseling-for-homeowners-and-renters. ↩
- Woodstock Institute, “Mortgage Access Initiative”, June 2023, https://woodstockinst.org/mortgage-access-initiative. ↩
- Institute for Housing Studies at DePaul University, “Strategies to Support Community Land Trusts in Illinois”, February 12, 2025, https://www.housingstudies.org/releases/community-land-trust-task-force-report. ↩
- Pilsen Housing Cooperative, accessed August 2026, https://www.pilsenhousingcoop.org. ↩
- June, Sophia, The New York Times, “For Gen Z, Building Wealth Is in the Stock Market, Not the Housing Market”, August 22, 2026, https://www.nytimes.com/2026/08/22/business/gen-z-houses-investing.html?unlocked_article_code=1.71A.126V.WenLy1k6DQe7&smid=url-share. ↩
- Corporate Coalition of Chicago, “Workplace Flex Fund”, accessed August 2026, https://www.corpcoalition.org/workplace-flex-fund. ↩
Methodology
Data sources and scope
HMDA data is collected and published by the Consumer Financial Protection Bureau (CFPB), covering financial institutions that meet applicable reporting criteria. This report analyzes Illinois home purchase mortgage applications from 2018 to 2024. All records are restricted to purchase loans for one-to-four-unit principal residences with a first lien position, excluding loans purchased from other institutions. Geography is structured in four tiers: Illinois statewide, six collar counties, suburban Cook County, and Chicago.
Population definitions
HMDA reports applicant age in 10-year brackets rather than exact birth years, while ACS provides more detailed age brackets. This report maps the available age brackets to generation labels and defines Millennials as ages 25–44, which is consistent with the HMDA classification and the ACS analysis.
| Generation | Birth Years | Implied Age (2024) | HMDA Age Bracket | ACS Brackets Used |
|---|---|---|---|---|
| Generation Alpha | 2013–2025 | 0–11 | — | under_5, 5_9, 10_14 |
| Generation Z | 1997–2012 | 12–27 | <25 | 15_17, 18_19, 20, 21, 22_24 |
| Millennials | 1981–1996 | 28–43 | 25-34, 35-44 | 25_29, 30_34, 35_39, 40_44 |
| Generation X | 1965–1980 | 44–59 | 45-54, 55-64 | 45_49, 50_54, 55_59 |
| Baby Boomers | 1946–1964 | 60–78 | 65-74 | 60_61, 62_64, 65_66, 67_69, 70_74, 75_79 |
| Pre-Boomer | before 1946 | 79+ | >74 | 80_84, 85_over |
Note: Birth year ranges follow standard generational definitions (Pew Research). HMDA’s 10-year brackets do not align precisely with these boundaries—the 25–34 bracket captures both true Millennials and early Gen Z aged 25–27. The Millennial definition used here (ages 25–44) is the closest available match given HMDA’s reporting structure.
Primary filters
The analysis applies the following primary filters:
- Geography: Illinois statewide, the six collar counties exclusively, suburban Cook County exclusively, and Chicago exclusively
- Loan purpose: Home purchase loans
- Property type: Properties with one to four housing units
- Occupancy: Principal residences
- Lien status: First-lien loans
- Borrower focus: Millennial applicants ages 25–44, corresponding to the HMDA age categories 25–34 and 35–44
- Years: 2018–2024
- Race and ethnicity: Asian, Black, Latine (also known as Hispanic, Latino/a, or Latinx), and White applicants; Other racial and ethnic groups are included as “Other” when needed
- Purchased loans: Loans purchased from another institution have been excluded.
Race and ethnicity classification
Race and ethnicity are derived from HMDA's Derived_Race and Derived_Ethnicity fields.
| Race Group | Condition | Source Field | Notes |
|---|---|---|---|
| Latine | Latine == 1 | Derived_Ethnicity == "Hispanic or Latino" | Ethnicity takes precedence over race; any applicant identifying as Hispanic/Latino is classified as Latine regardless of reported race |
| Asian | Asian == 1 | Derived_Race == "Asian" | Non-Hispanic only |
| Black | Black == 1 | Derived_Race == "Black or African American" | Non-Hispanic only |
| White | White == 1 | Derived_Race == "White" | Non-Hispanic only |
| Other | All remaining | Multiracial, AIAN, Native Hawaiian, joint applicants with indeterminate race, not reported | Residual category |
The "Other" category is excluded from chart displays but retained in all denominators when computing percentage shares, ensuring that shares for the four displayed groups reflect their true proportion of the full applicant pool.
Lender type classification
Each HMDA record is classified into Bank, Credit Union, or Non-Bank using a hybrid approach matched to HMDA records via Legal Entity Identifier (LEI):
- Primary source: CFPB HMDA API institutional type data (InstAPI), applying RiskExec classification methodology
- Fallback source: RiskExec multi-year respondent panel (2019–2024), used where InstAPI matching is unavailable
- Unmatched records: Classified as
Other/Unknownand excluded from all lender type analyses
Statistical methods
| Method | Application | Notes |
|---|---|---|
| Pooled data (2018–2024) | Cross-sectional analyses: lender type share, loan type distribution, sex composition, race share of originations | Labeled "2018–2024 pooled" throughout |
| Annual data | Trend analyses: origination rate, denial rate, loan cost, LTI ratio, application volume | Year as x-axis, 2018–2024 |