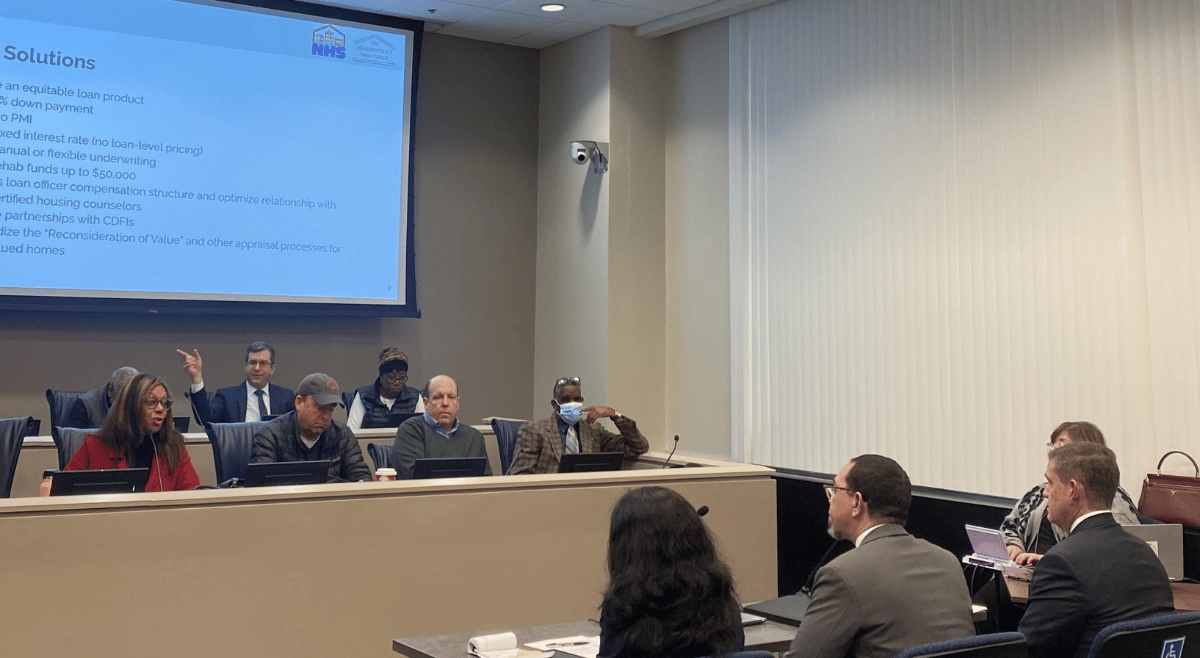
The presentation below is from the City of Chicago’s annual subject matter hearing on municipal depositories on Monday, February 9, 2026. Woodstock President & CEO Horacio Mendez shares 2024 lending data to evaluate whether the City’s banks are making progress in closing historical racial and economic disparities in both mortgage and small business lending.
Passed in September 2021, the Lending Equity Ordinance increases transparency around how financial institutions the City banks with are serving Chicago’s communities in part as a response to findings that Chicago lenders had invested more in a single white neighborhood than all Black neighborhoods combined.
The ordinance requires banks to submit data on their lending practices, loan distribution across different neighborhoods, branch locations, and demographics of local employees in order to do business with the City. The law also mandates annual public hearings evaluating whether progress has been made in closing lending gaps.
The testimony is available below or can be watched here (testimony begins at 01:26:40).
Watch now (testimony begins at 01:26:40)
The banks and their most recent Community Reinvestment Act (CRA) ratings
O = Outstanding; S = Satisfactory; NTI = Needs to Improve
- Albank (aka Albany Bank & Trust) (S)
- Amalgamated Bank of Chicago (S)
- Bank of America, N.A. (O)
- BMO Bank, N.A. (O)
- Citibank, N.A. (O)
- Fifth Third Bank, N.A. (O)
- First Eagle Bank (O)
- GN Bank (NTI)
- JPMorgan Chase Bank, N.A. (S)
- Old National Bank (S)
- PNC Bank, N.A. (O)
- The Huntington National Bank (O)
- US Bank, N.A. (O)
- Wells Fargo Bank, N.A. (O)
- Wintrust Bank, N.A. (O)
Testimony
Good morning and thank you for having me back again to discuss how the banks that want to serve City Government are serving Chicago residents. I have 5 minutes to provide an hour of data, so I’ll get right to the point.
First, I want to share with the Committee that these hearings matter, and we have an example of that in Old National Bank. They were at the bottom of almost every factor we analyzed last year. After my testimony, I had a message waiting at my office from their executive team—“We need to talk; and now.” For a second, I thought they found an error in our analysis and were going to sue us. Instead, they walked me through what they were doing for their numbers to improve. They delivered and came in third overall in terms of how they compare to the other institutions that responded to the City’s Request for Proposals to serve as municipal depositories.
We have two respondents that are Community Development Financial Institutions (First Eagle Bank and GN Bank), which means they’re mission-driven institutions that provide credit and financial services to underserved communities We also have one Minority Depository Institution, which means their ownership and/or the communities they serve are predominantly of color.
Unfortunately, the institution that is both a Community Development Financial Institution and a Minority Depository Institution, GN Bank, received a Needs to Improve on their last CRA exam. All others had either an Outstanding or Satisfactory CRA rating.
Overall, public information about each institution is limited, so we’re showing you what we have that can serve as an indicator on how they’re serving communities of color and low- and moderate-income (or LMI) communities in mortgage and small business lending. And we’re comparing them to each other so we could see who stands out.
You’ll notice that these charts exclude some of the banks from the list. In order to be fair, we didn’t want to pit banks that do a lot of loans in this market against banks where mortgage or small business lending isn’t a big part of their business model.
Here are the highlights.
Data Analysis

Let’s start by looking at how well these banks do at attracting mortgage applications from borrowers of color. This chart shows how many of each bank’s mortgage applications came from minority borrowers. The overall peer average here is just over 52%, which is an increase from last year when it was just under 50% and an even bigger improvement from 2024 when it was 40%. US Bank is on top with 62% of their applications from minority borrowers, with BMO close behind and Bank of America in 3rd place. “Most Improved” would be Bank of America who jumped from 40% to 56% and Old National who jumped from 40% to 54%.
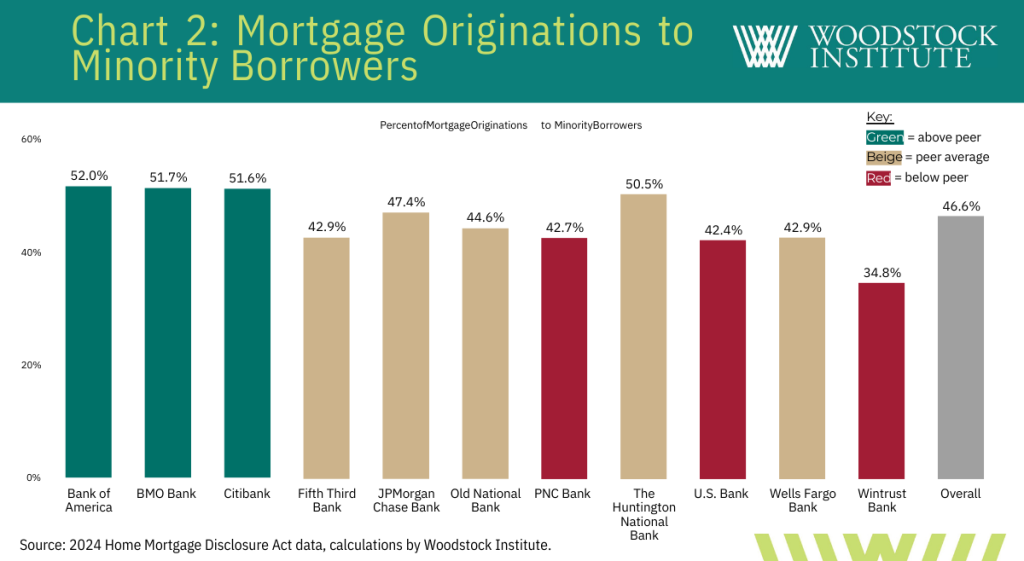
This next chart shows how many of those applications turned into an approved loan. The highest performers here are Bank of America, BMO and Citibank, with Huntington close behind. Last year, Bank of America was below peer on attracting mortgage applications from borrowers of color but ranked at the top of their peers in turning those applications into loans. This year, they stayed on top in turning applications into loans, but they significantly upped their game in attracting more applications.
Citibank is now where Bank of America was last year in underperforming on applications from borrowers of color but doing a decent job of turning those into approved loans.
In the previous slide, we saw US Bank at the top for the number of applications from minorities they received. They’re below peer in turning those into approved mortgages. We don’t want to penalize effective marketing of products to borrowers and getting a lot of applicants that may not be qualified—but this does give us an opportunity to talk with them on how to improve those outcomes.
Congrats to Old National that improved from 27% to 44.6%.

Let’s transition to the same analysis, but for low-to-moderate income (LMI) borrowers. The high performers on getting applications are Old National, PNC, and Huntington.

In terms of turning those applications into approved mortgages, the next chart shows Old National’s streak continuing from bottom last year to top performer this year, with BMO and Bank of America in 2nd and 3rd.
Again, you have the situation with PNC and Huntington where they did a good job of attracting applications from LMI, but not as good a job in turning those into loans, where BMO and Bank of America were middle of the pack in attracting applications, but outperformed peers in turning those into loans.

Our last 2 mortgage charts focus on geography. Chart 5 looks at how these banks did at attracting applications from majority-minority census tracts. You’ll recall that US Bank was a high performer on getting applications from minority borrowers, so it’s no surprise they’re a top performer here.
Wells Fargo, who was middle of the pack on getting applications from minority borrowers, and PNC Bank, who was bottom of that pack, are leaders in getting applications from minority census tracts. There may be a few reasons for this, but the one that comes to mind is that while they’re doing well in attracting mortgage applicants in minority communities, many of those applicants aren’t minorities.

Chart 6 looks at how many of each bank’s originations came from minority census tracts. You’ll recall that BMO was a high performer on originating loans to minority borrowers so, again, it’s no surprise they’re a top performer here. Chase and our most improved player, Old National, tied for 2nd, but were neck-and-neck with BMO.

Finally, Chart 7 shows us how many small business loans went to LMI census tracts. Small business data is very limited, so we can’t do the same analysis as we did for mortgage. The high performers here are PNC, Fifth Third, and Bank of America.
So – which bank stands out?
Bank of America was the highest performer on these charts. They were average on attracting applications from LMI borrowers and minority communities, but they outperformed peers on every other factor we had data on.
BMO was close behind, but their underperformance in small business lending prevented them from overtaking Bank of America for the top spot.
Notes
- GN Bank received Needs to Improve (NTI) on most recent CRA exam (2023).
- All others received CRA ratings of Satisfactory (S) or Outstanding (O) on their most recent exam.
- Community Development Financial Institutions (CDFIs) include First Eagle Bank and GN Bank
- Minority Depository Institutions (MDI) include GN Bank
Notes on Data Analysis
- Mortgage: Banks with fewer than 100 mortgage applications in Chicago in 2024 have been excluded from the mortgage charts, to do a fair comparison.
- Albank, Amalgamated, First Eagle, GN excluded from mortgage charts.
- All other banks that remain in the charts received at least 500 applications.
- Small Business: Reported under the CRA and is at the County level.
- Albank, First Eagle, GN were not in the CRA small business loan dataset.
- Amalgamated was also excluded from charts because their line of business for this product was much smaller than others in the charts
- Wintrust operates under 16 different charters. For the purposes of today, we pooled them all together under the label “Wintrust.”
Appendix: Data Analysis Definitions
- Charts include color coding for a peer analysis –green are the high performers among this group, red are the low performers among this group.
- Below peer = 1st quartile, aka “bottom 25%”
- Peer average = 2nd and 3rd quartiles, aka “middle 50%”
- Above peer = 4th quartile, aka “top 25%”
- “Minority” in these charts include: Asian, Black or African American, Native American, Pacific Islander, Latine, and Multi-racial
- “LMI” = low-and moderate-income. Low = 60% or below of Area Median Income (AMI). Moderate = 60-80% of AMI