The 2024 data is in! Visit Woodstock Institute’s updated Community Lending Data Portal for free and easy access to Illinois’s 2024 Home Mortgage Disclosure Act (HMDA) data. We are excited to share new features that further facilitate analysis of mortgage and small business lending data across Illinois.
This resource empowers local leaders to identify racial and economic lending disparities in their communities. Users can see how mortgage access, foreclosures, bank branches, and small business credit varies across demographics and how specific lenders are (or aren’t) meeting the financial service needs in their communities.
New In This Update
- View data at the ward-level for Chicago. Users can now analyze lending data at the aldermanic level across race and income levels. Compare this data to outcomes in other wards, different Chicago city regions, or to the City of Chicago as a whole. Local leaders can leverage this data to identify racial and economic lending disparities and advocate for policy changes and greater investment in specific communities.
- Share of homeownership has been added to the Overview tab to help users identify who owns homes in a community.
- View small business data in the “Patterns of Disparity Dashboard” and “Top Small Business Lenders by County.” Additional details are below.
- Federal Housing Administration (FHA) loan originations and loan cost data are now displayed on the Mortgage tab. Additional details are below.
- Data has been updated: 2024 Home Mortgage Disclosure Act data; 2023 U.S Census Bureau data; 2023 Community Reinvestment Act small business lending data; 2023 and 2024 bank branch data; and 2023, 2024, and 2025 (through August) foreclosure filings.
- An in-depth user guide showing how to use the portal with definitions of key terms is available here.
Small Business Data Revamp: Patterns of Disparity Dashboard and Top Small Business Lenders by County
Our new Patterns of Disparity Dashboard allows users to easily identify racial and economic small business lending disparities within and across different geographies. This tool builds on Woodstock Institute’s Patterns of Disparity: Small Business Lending series, which examined small business lending patterns in different regions across the US.
Users will now be able to compare (by year and geography), the proportion of active small businesses by census tract income level (low, moderate, middle, and upper income) and proportion of non-white residents, with their share of the total amount of loans in dollars and percent and the total number of loans. This will allow users to analyze how small business lending patterns vary relative to the racial and economic makeup of an area.
For example, St. Clair County, Illinois (which include the cities of Belleville and East St. Louis) shows patterns of lending disparities in 2023 (Figure 1 & 2). As seen in Figure 1, low-income census tracts in St. Clair County contained 15.4 percent of active businesses but received only 6.5 percent of originated small business loans and just 5.7 percent of the total loan dollar volume. Meanwhile, upper-income tracts contained only 9.7 percent of the county’s active small businesses yet received 23.6 percent of loans and 20.3 percent of the total loan dollar volume.
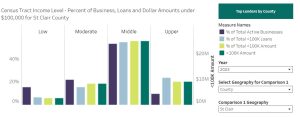
In Figure 2, a similar disparity is visible when examining the lending distribution relative to the racial makeup of different census tracts in St. Clair County. For census tracts that have 60 percent or more non-white residents, the share of active businesses did not have an equal share of small business lending by dollar amount and number of loans. For census tracts with less than 20 percent of non-white residents, the share of small business lending was slightly higher than the share of active businesses.

As seen in Figure 3, the Top Small Business Lenders by County table offers a quick view of which financial institutions are most active in a given geography. In 2023 in St. Clair County, American Express made the most loans under $100,000, originating 815 loans totaling $8,640,000.

New Metrics
- Federal Housing Administration (FHA) loan origination data: Shows the number of loan originations in a given geography that were FHA loans. The Federal Housing Administration guarantees FHA loans and offers a path to homeownership for those who would otherwise not be eligible for a conventional mortgage. However, given the higher costs associated with these loans, advocates have expressed concern over Black and Brown applicants being steered towards these products despite qualifying for conventional loans.
- Loan Costs – Lower-income borrowers and borrowers of color typically pay more in loan costs and disproportionately take out high-cost loans (those with fees over $5,000), putting homeownership further out of reach. In the Chicago region, high-cost loans have surged in recent years. New loan costs metrics have been added to the Mortgage tab of the data portal
-
- Median loan costs: Loan costs encompass the total amount of fixed and variable costs a borrower pays to obtain a mortgage, including origination fees, appraisals, closing costs, and administrative costs.
- Median cost-to-loan ratio: The median loan costs expressed as a percentage of the total loan amount for originated loans.
- Median cost-to-income ratio: The median loan costs expressed as a percentage of the applicant’s income for originated loans.
- Median cost-to-property value ratio: The median loan costs expressed as a percentage of the property’s value for originated loans.
For ongoing research and analysis, visit Woodstock Institute at www.woodstockinst.org/research.